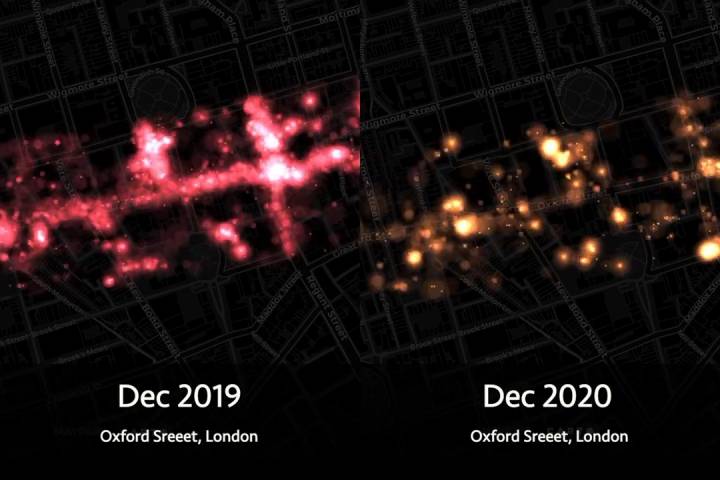
With the festive season behind us and the new year begun, Huq looks back at high-street footfall during the Christmas shopping period between December 15-24th for Oxford Street, London and the Grand Vía, Madrid.
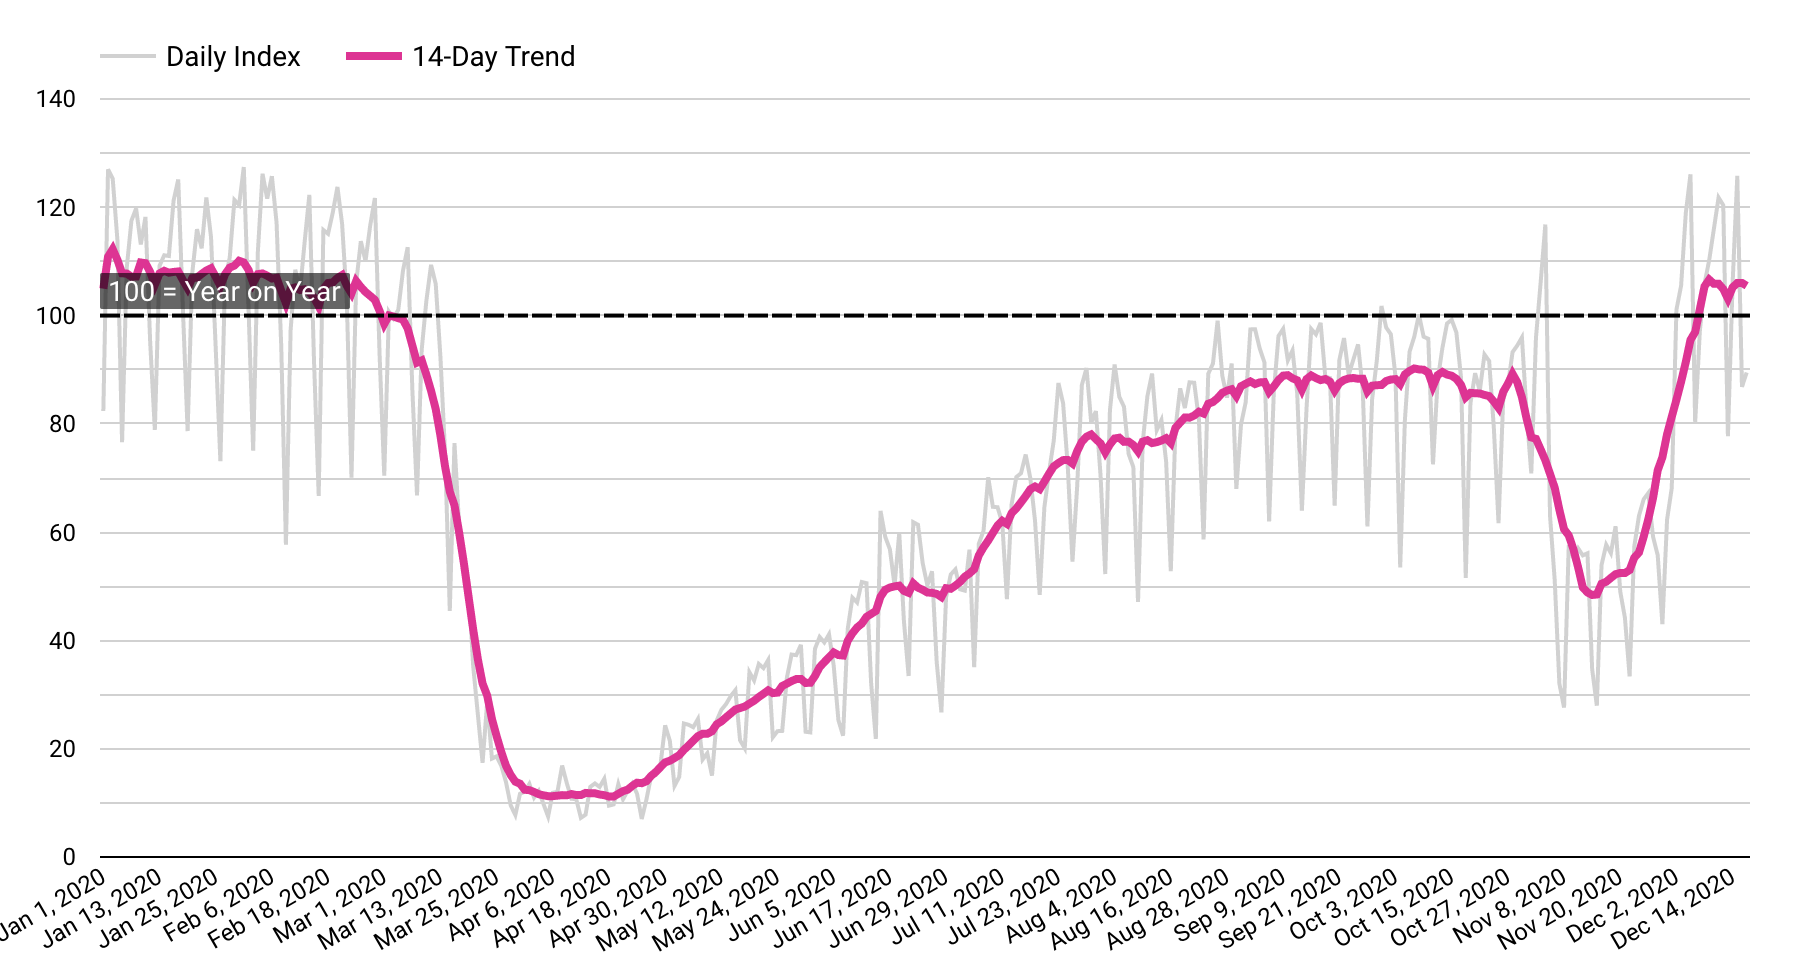
We often provide outputs from our geolocaton dataset in the form of a time-series index as this is one of the most effective ways to highlight the information contained within the underlying mobility data.

While activity was certainly down on the equivalent period for 2019, there were some surprises with Oxford St footfall approaching January levels before the city went into T-4 lockdown ahead of the Christmas break.
Today however we have chosen to contrast the footfall for the period December 15-24th 2019 and 2020 using an animated ‘Torque’ map provided by Carto as a visual and engaging way to demonstrate the composition of our data.
To learn more about the data behind this article and what Huq has to offer, visit https://huq.io/.


Sign up to receive our stories in your inbox.
Data is changing the speed of business. Investors, Corporations, and Governments are buying new, differentiated data to gain visibility make better decisions. Don't fall behind. Let us help.


Sign up to receive our stories in your inbox.
Data is changing the speed of business. Investors, Corporations, and Governments are buying new, differentiated data to gain visibility make better decisions. Don't fall behind. Let us help.


