
In the most recent edition of our quarterly Economic Indicators Report, we see promising signs of recovery from the coronavirus pandemic. The fourth quarter of 2020 saw an increase in active job listings and a decrease in volatility.
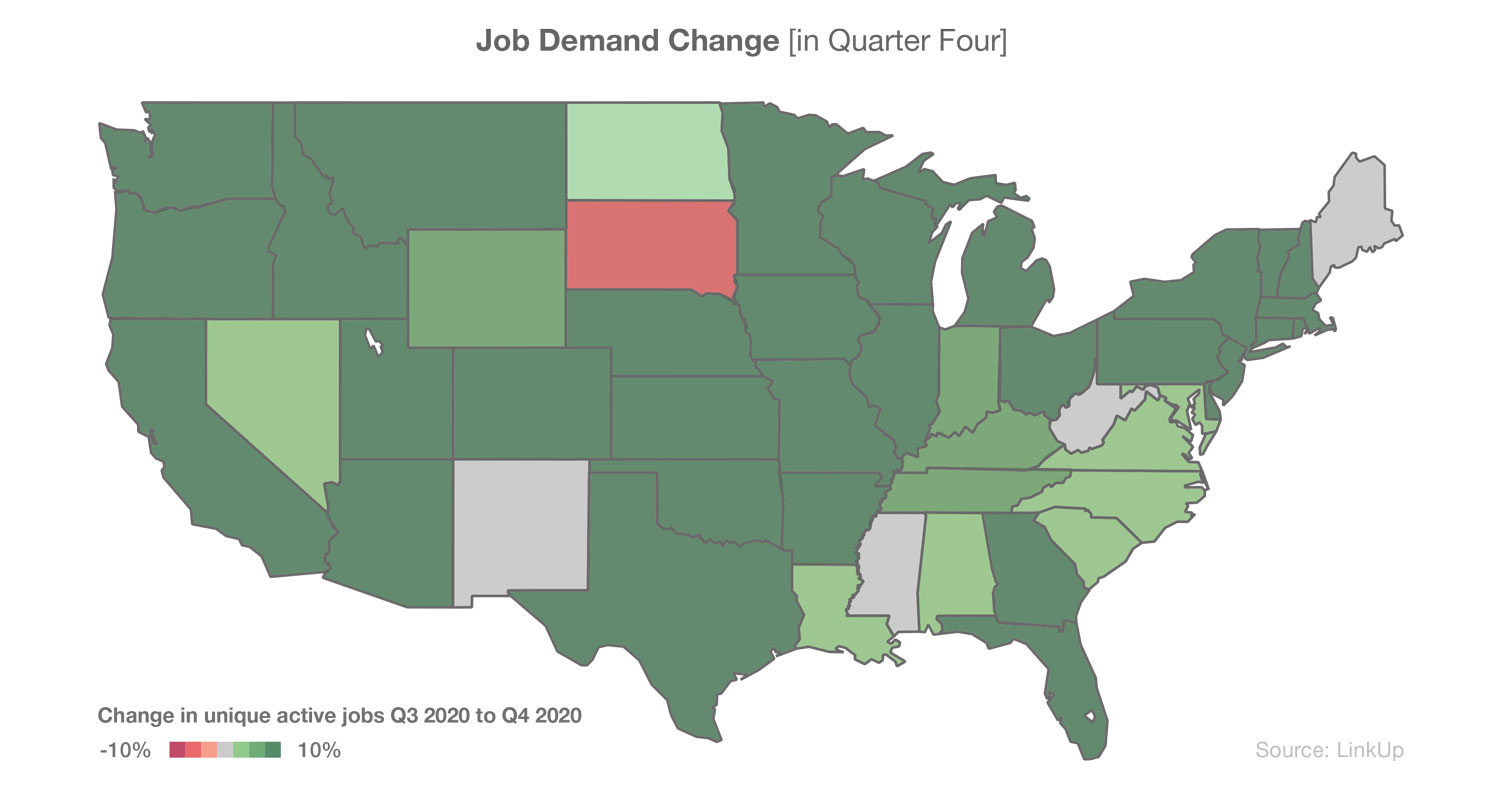
Overall, total active job listings increased more than 6% in Q4. This is almost an exact flip from the same period in the previous year–Q4 2019 saw active job listings down 5%. At the state level, the quarter showed widespread positive movement. An impressive 49 states saw gains over the quarter, leaving South Dakota as the only state with a loss in active listings.
Job demand volatility (the speed at which hiring increased or decreased over the quarter) continues to flatten after the substantial increases witnessed in Q2 2020 and a stagnant Q3. Prior to that Q2 spike, driven by COVID-related business shutdowns, volatility was mostly steady from Q4 2018 through Q1 2020. The leveling out of this figure in Q4 indicates that many employers may be regaining the confidence needed to resume hiring.
Examining job market diversification, we saw the biggest gains in the metropolitan statistical areas (MSA) of Providence-New Bedford-Fall River, RI-MA; Bridgeport-Stamford-Norwalk, CT; and Knoxville, TN. The MSAs with the biggest losses were Dayton-Springfield, OH; Rochester, NY; and San Diego-Carlsbad-San Marcos, CA. Job market diversification scores measure the diversity of listings across metropolitan statistical area, sector, company, and occupation.

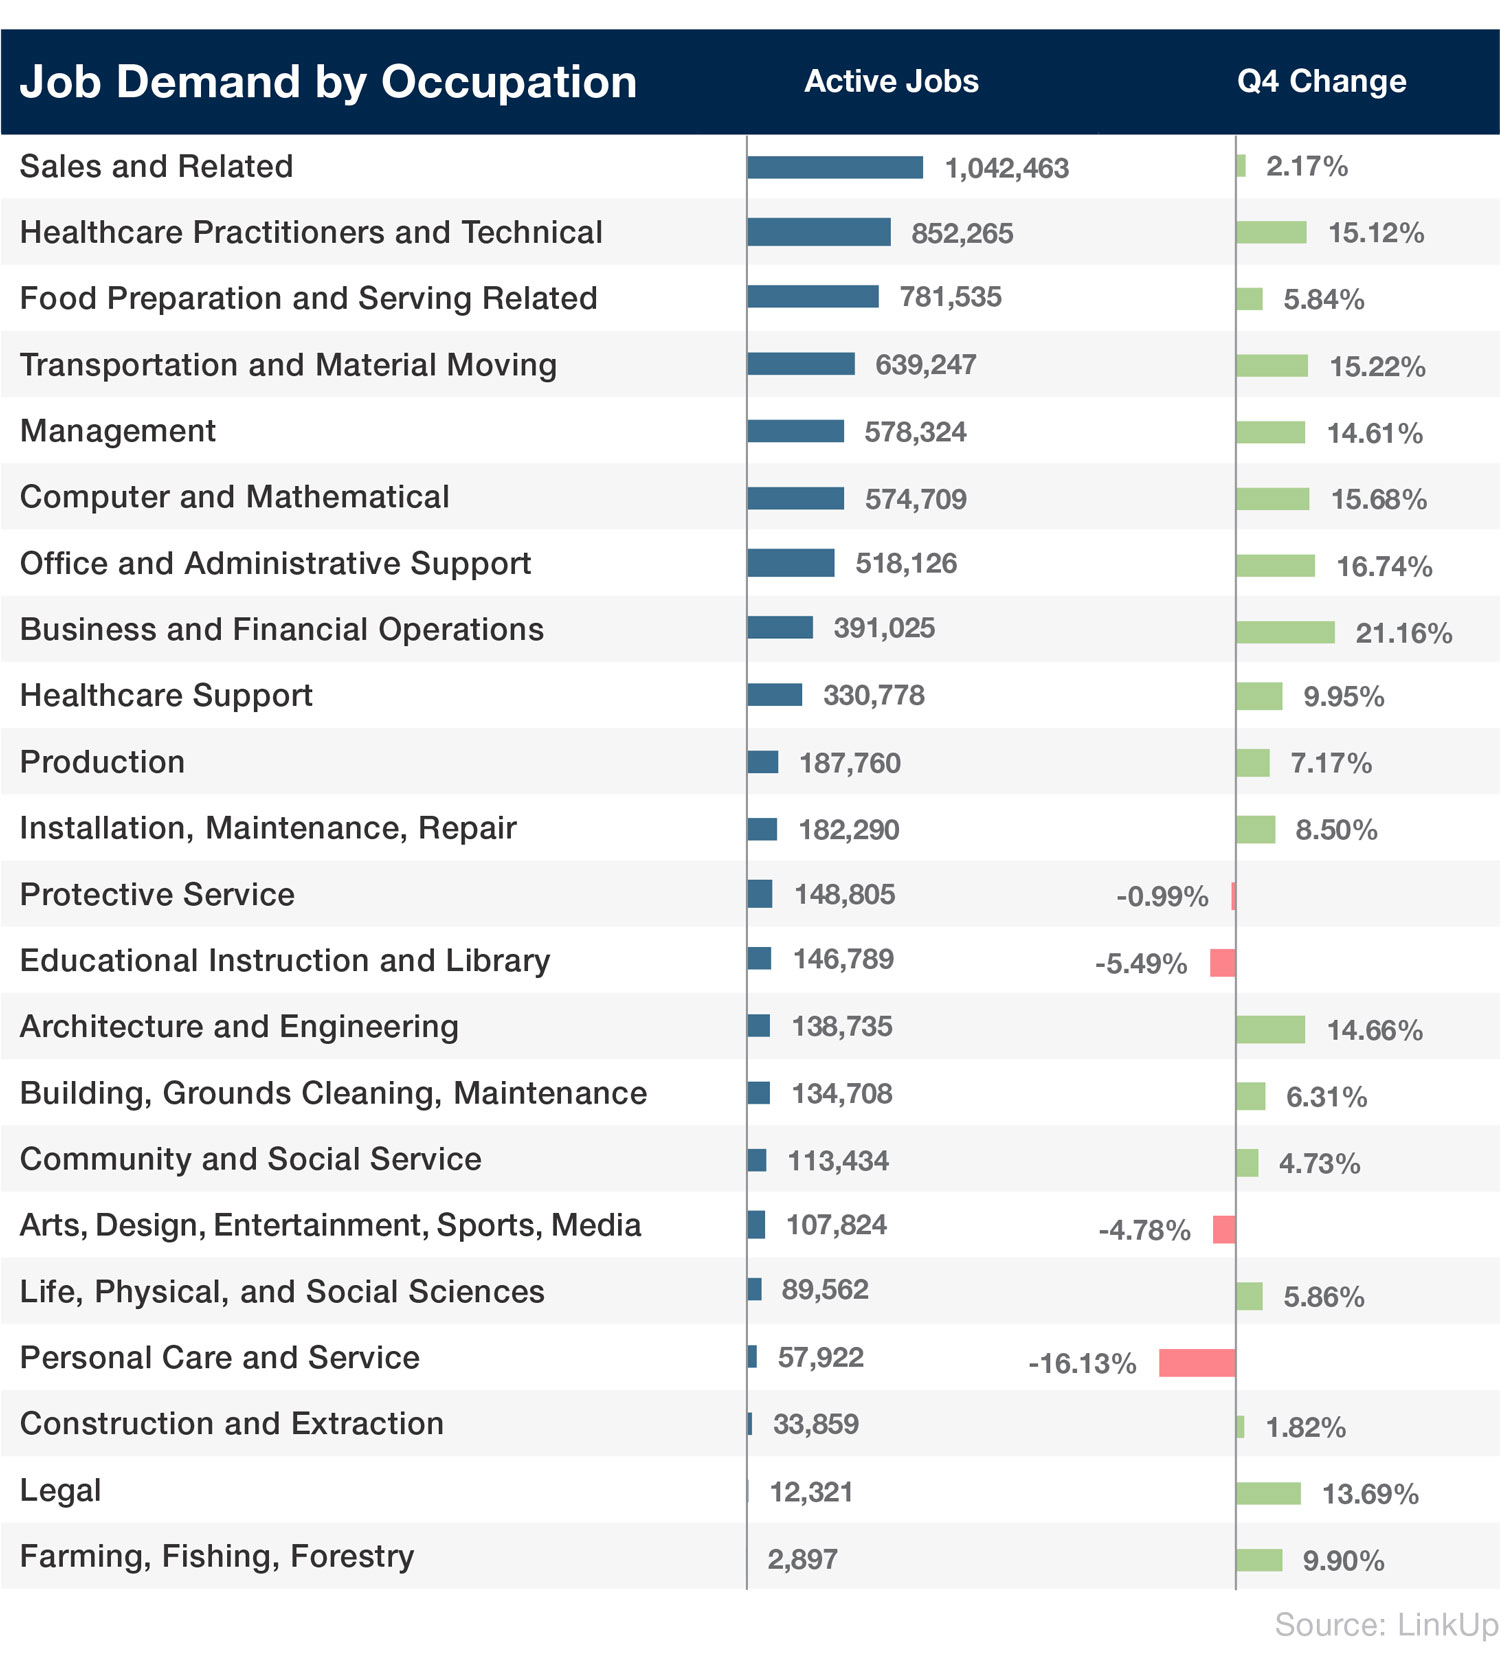
At the occupation-level, the fourth quarter largely mirrors the previous year. The top 3 occupations were identical to what we saw in Q4 2019: Sales and Related, Healthcare Practitioners and Technical; and Food Preparation and Serving Related; while number four changed from Management in Q4 2019 to Transportation and Material Moving in Q4 2020, likely a nod to the pandemic-spurred increase in shipping and delivery.
To learn more about the data behind this article and what LinkUp has to offer, visit https://www.linkup.com/data/.


Sign up to receive our stories in your inbox.
Data is changing the speed of business. Investors, Corporations, and Governments are buying new, differentiated data to gain visibility make better decisions. Don't fall behind. Let us help.


Sign up to receive our stories in your inbox.
Data is changing the speed of business. Investors, Corporations, and Governments are buying new, differentiated data to gain visibility make better decisions. Don't fall behind. Let us help.