
Characterizing the “Whales”: Mining In-App Purchase E-Receipts Data
“Whales” are usually referred to as a small group of people who contribute a large percentage of revenues in successful games. These users’ purchasing behavior can be very different from regular users. Previous studies showed that 1% of the users are responsible for over 59% of the revenues on iPhone’s marketplace in the US. In 2019, revenues from the top 10 mobile games on both iOS and Android account for 15.8% of total app revenues. Behind the lucrative mobile game earnings, only a small fraction of spenders are responsible.
However, to identify potential “Whales” is not easy.
In this blog post, we’d like to share how Measurable AI’s own e-receipts data on in-app purchases can be used to help game developers better understand their customers and potentially to build more accurate advertising targeting.
Currently, Measurable AI offers in-app-purchase receipts datasets from both Apple’s App Store and Google Play. Every time a digital purchase happens on an iPhone or iPad, users will receive an email receipt sent from Apple or Google Play with details of the purchase. Each Apple email receipt comes with a specific format that includes the full name and type of the service, time of the purchase, amount of money spent, and the quantity involved. Measurable AI’s data panel covers billions of e-receipts data collected directly from users who opted-in data sharing with our own consumer apps.
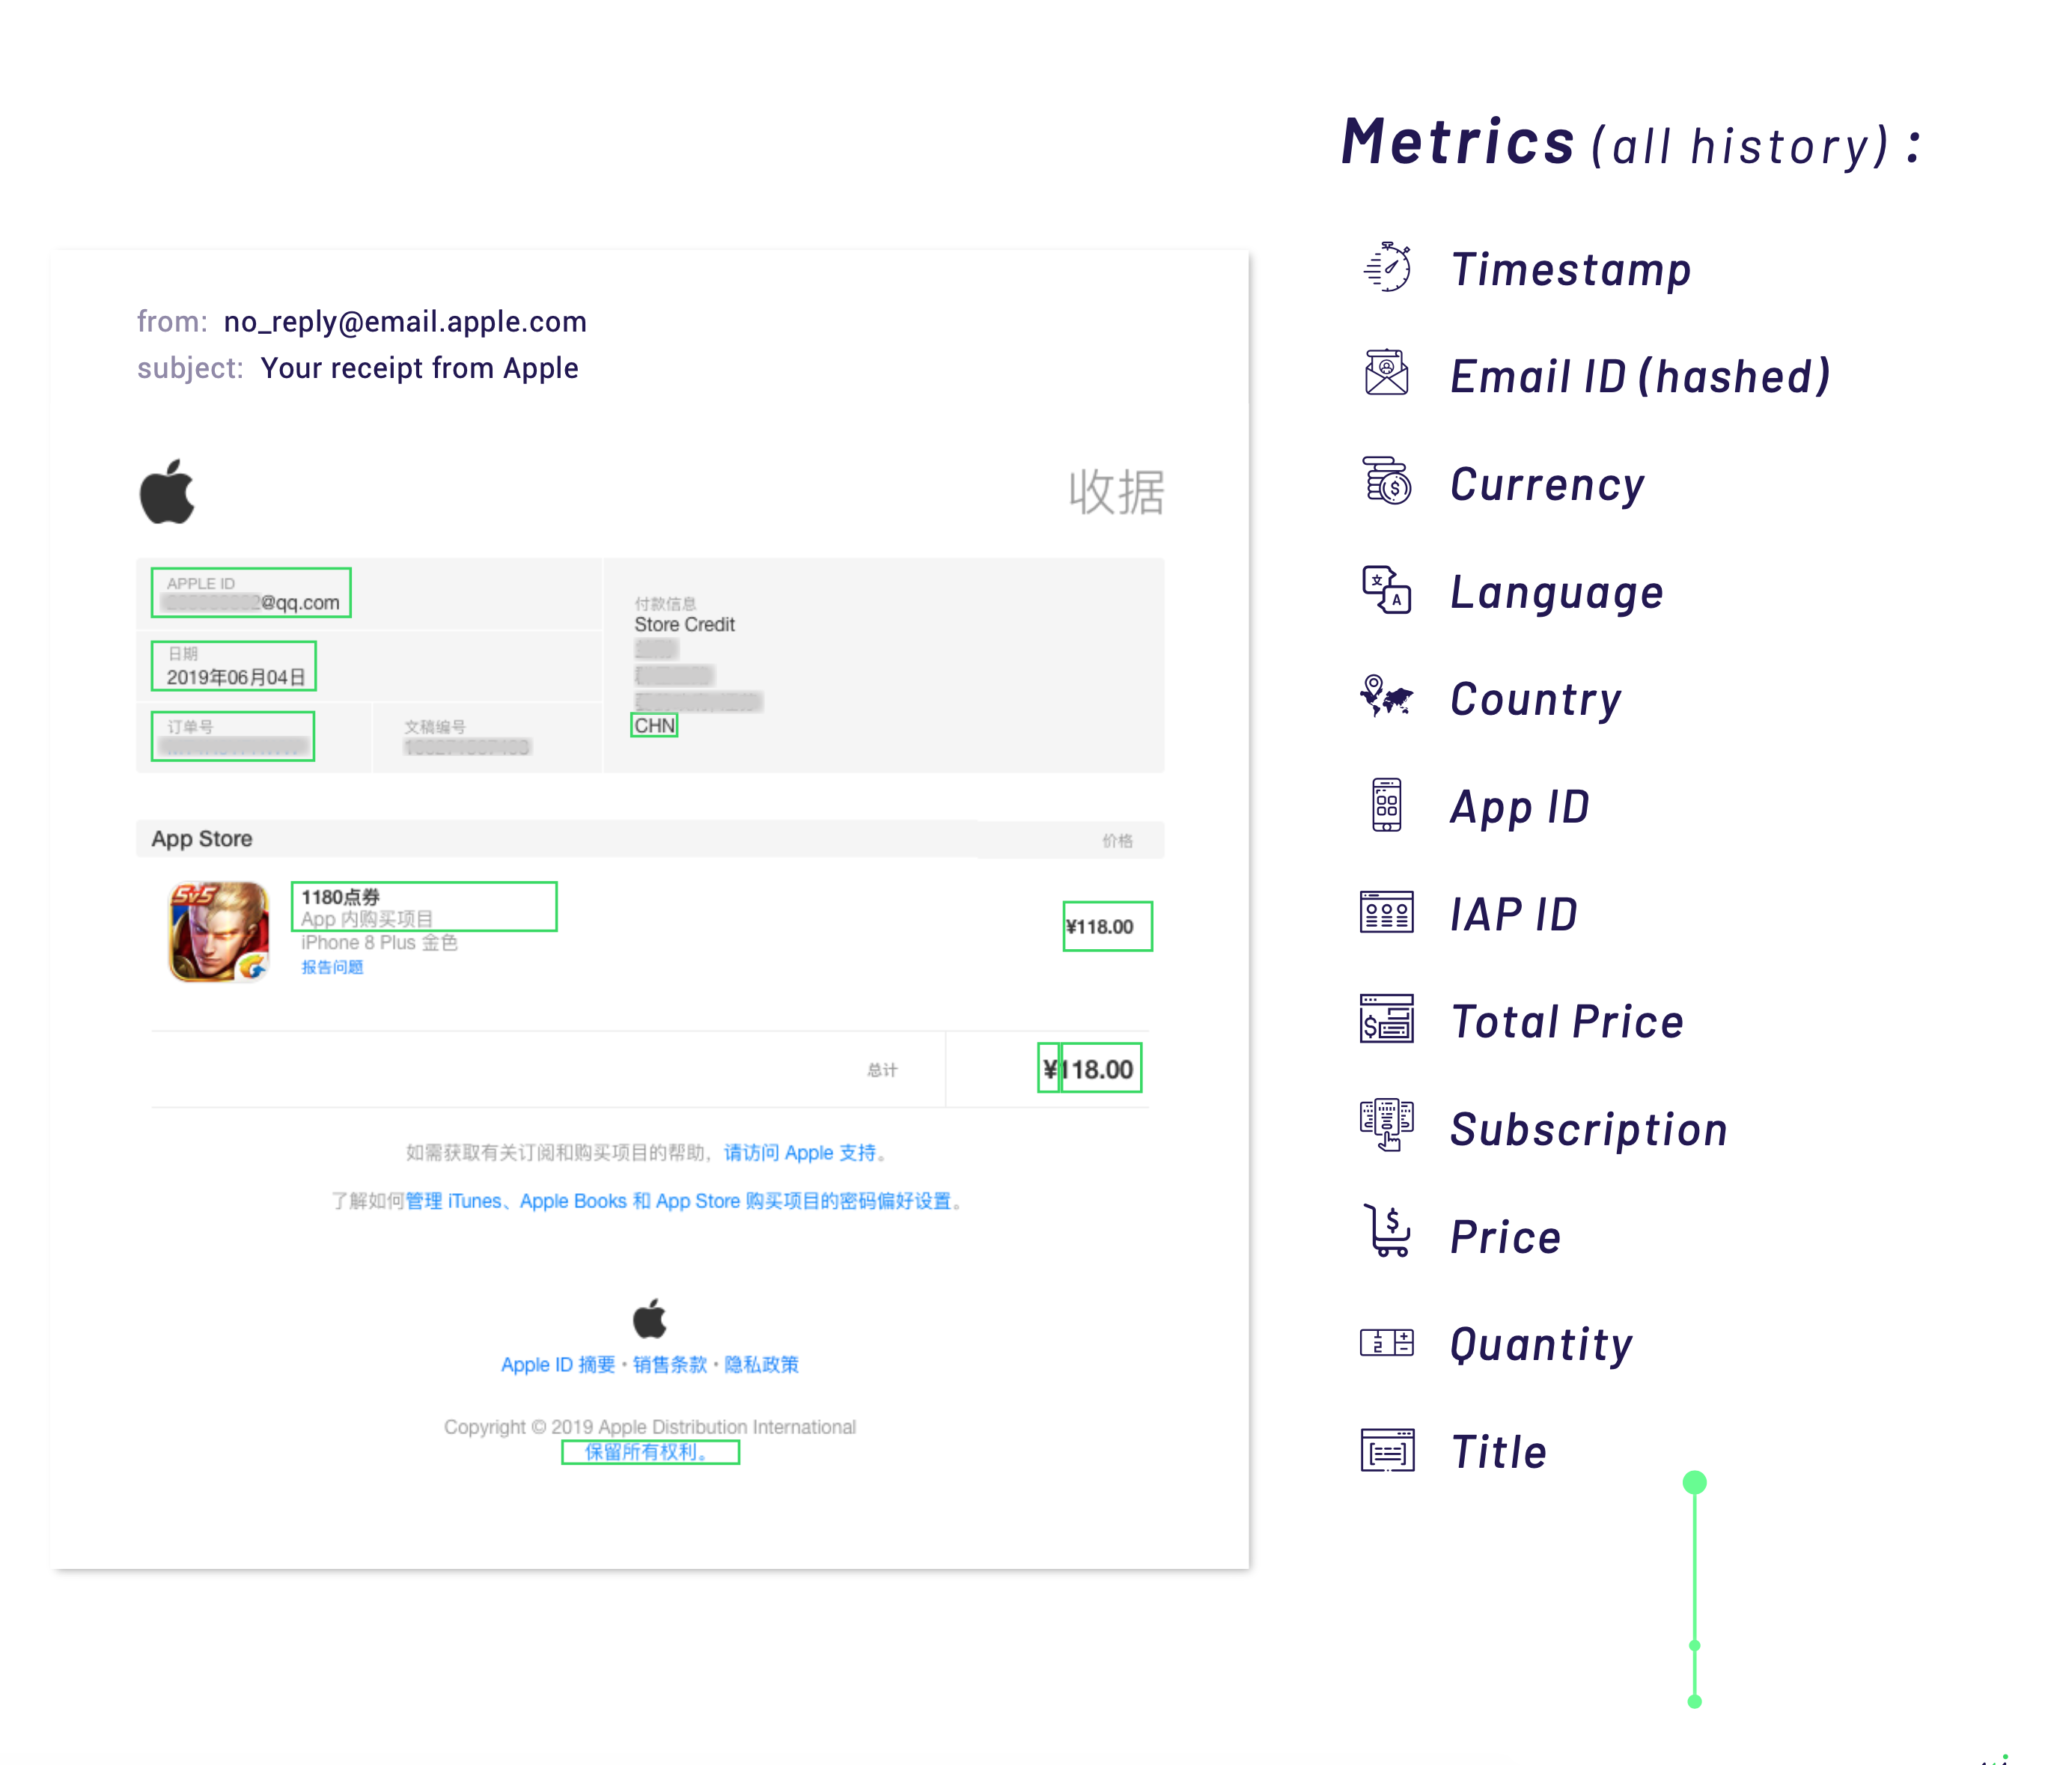
Apriori is a popular algorithm for extracting frequent itemsets with applications in association rule learning. The apriori algorithm has been designed to operate on databases containing transactions, such as purchases by customers of a store. An itemset is considered as “frequent” if it meets a user-specified support threshold.
In this specific case study, we will use association rule methodology to identify big spending gamers’ “frequent” In-App Purchase behavior across different popular mobile games. Based on the total dollars spent, we include the top-grossing mobile games from Measurable AI’s data panel. At last, we have 11 top-grossing apps selected, each with a unique App ID from Apple’s App Store.
In Measurable AI’s data panel, structured raw data with different attributes can be exported based on specific requirements. EmailID, Timestamp, Currency, game ID, In-App-Purchase ID are chosen as primary required attributes to identify the export. Unnecessary attributes from the dataset are removed. App ID is normalized to game 1-11.
Results showed that for popular games like PUBG Mobile: In-App Purchase items priced at CNY 648.00 and 328.00 represent only 10% of the total purchasing activities, but contribute more than 50% of the total revenues. In this dataset, we assume an In-App Purchase order with an amount larger than or equal to CNY 328.00 as Big Spend activity. Next, we marked “b” for Big Spends in the “spend” column, and the rest of paying activities as “s” for Small Spends to continue further analysis.
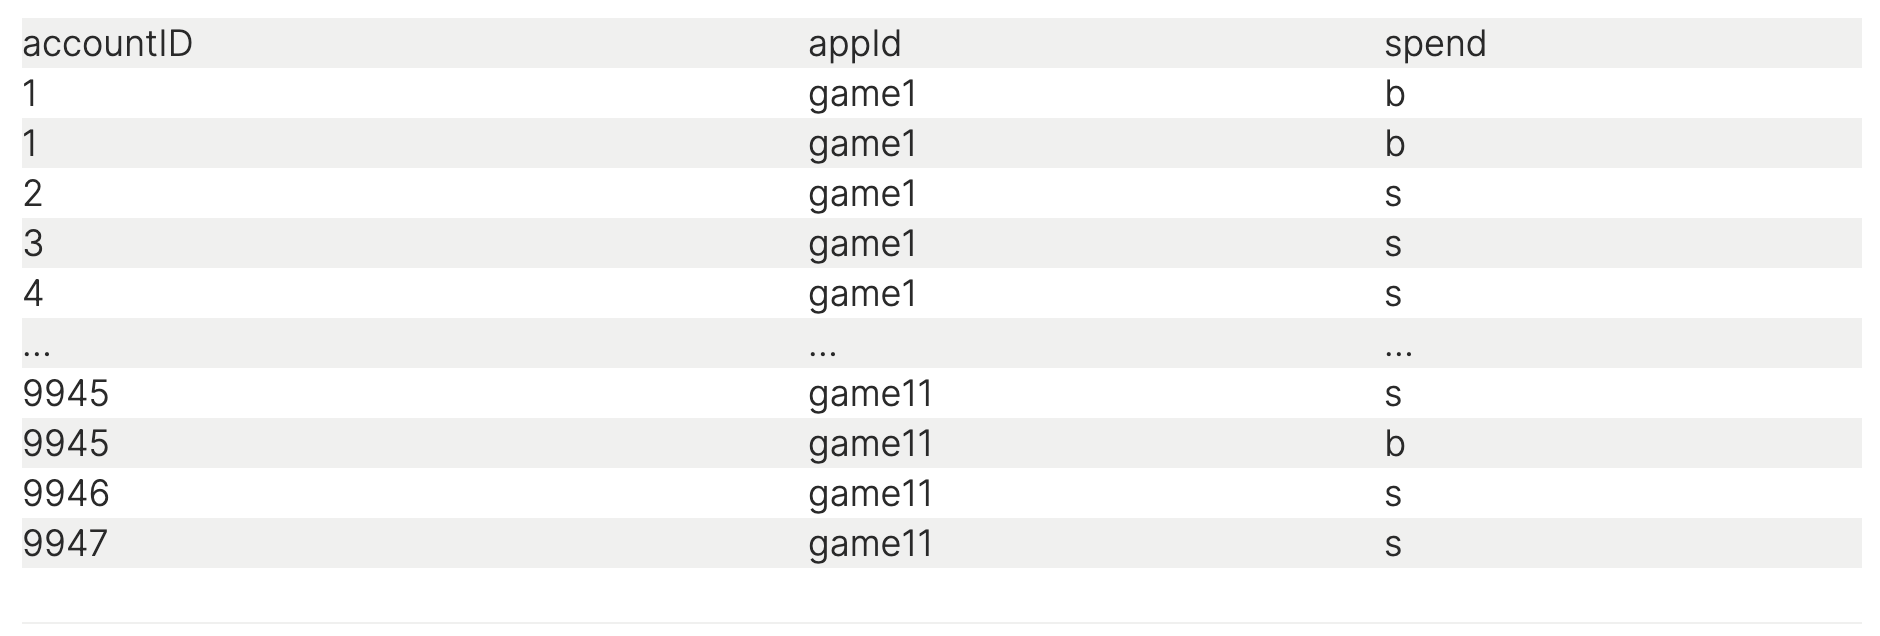
After merging the dataset by accountID and transforming it into 0-1 matrix, the dataset is ready for generating frequent itemsets and association rules.
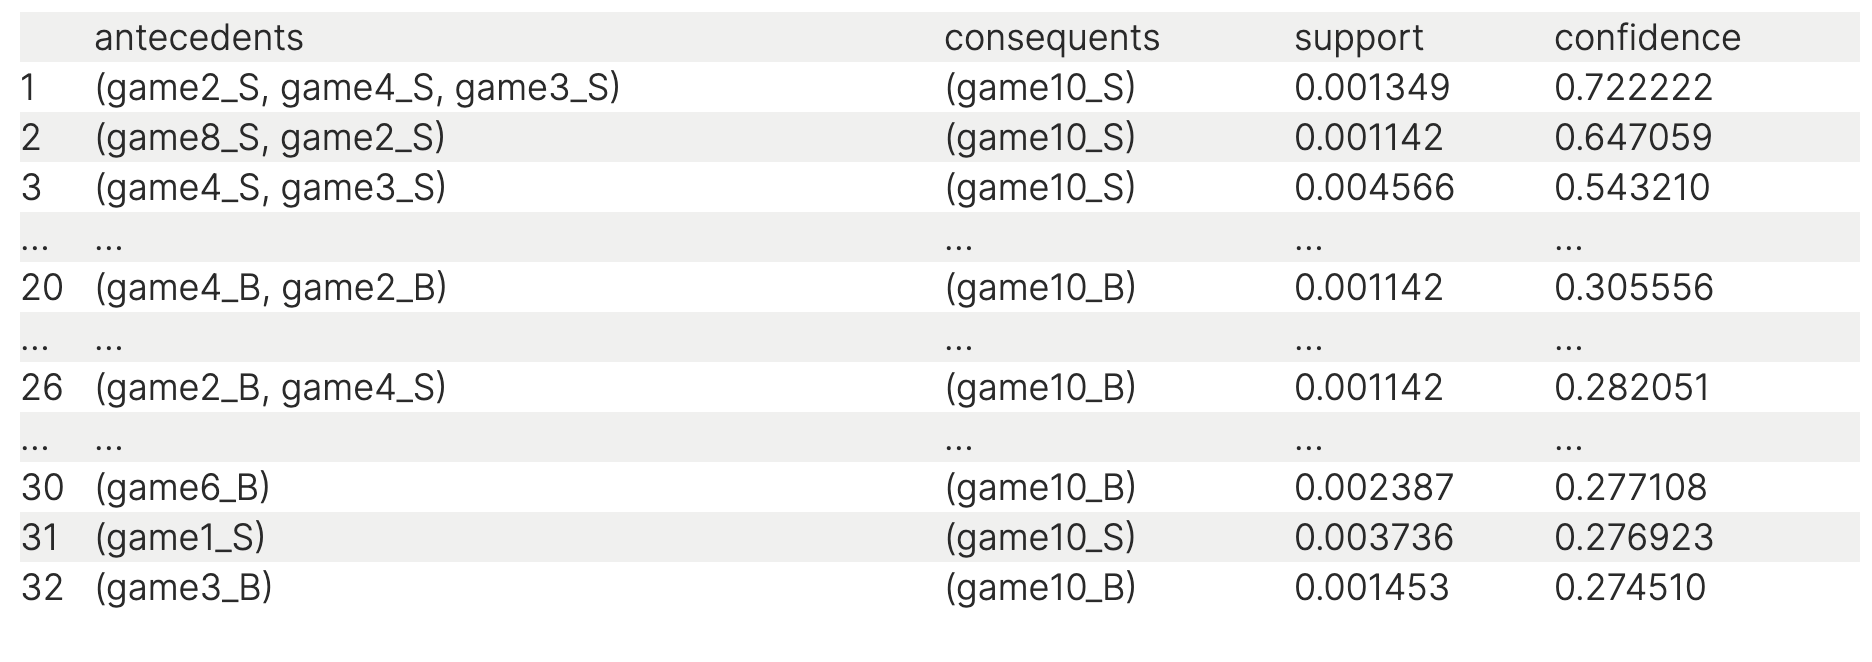
We use game10 (Honor of Kings) as consequent, as we can see from the result, game10_S had a very high confidence rate since it’s the most popular mobile game in China with a huge paying gamer base that overlaps with many other games.
Small spenders of Game2, Game4, and Game3 have a very high confidence rate around 72% to be small spenders of Game10. Based on all the results, specific spending patterns are found among big spenders with a confidence rate around 25-30%. It is also shown that users of Game 6 have around 27% of confidence rate to be big spenders of Game 10.
Gaming companies spend trillions of dollars on advertising every year, looking for whale spenders. Actually, with a simple model as proposed in this study, more accurate targeting can be realized with association rules.
When Measurable AI’s data business first started, we developed a data dashboard specifically for app developers with our in-app-purchase e-receipts data. On the dashboard, customers can monitor real-time spending, purchase retention of different apps and games.
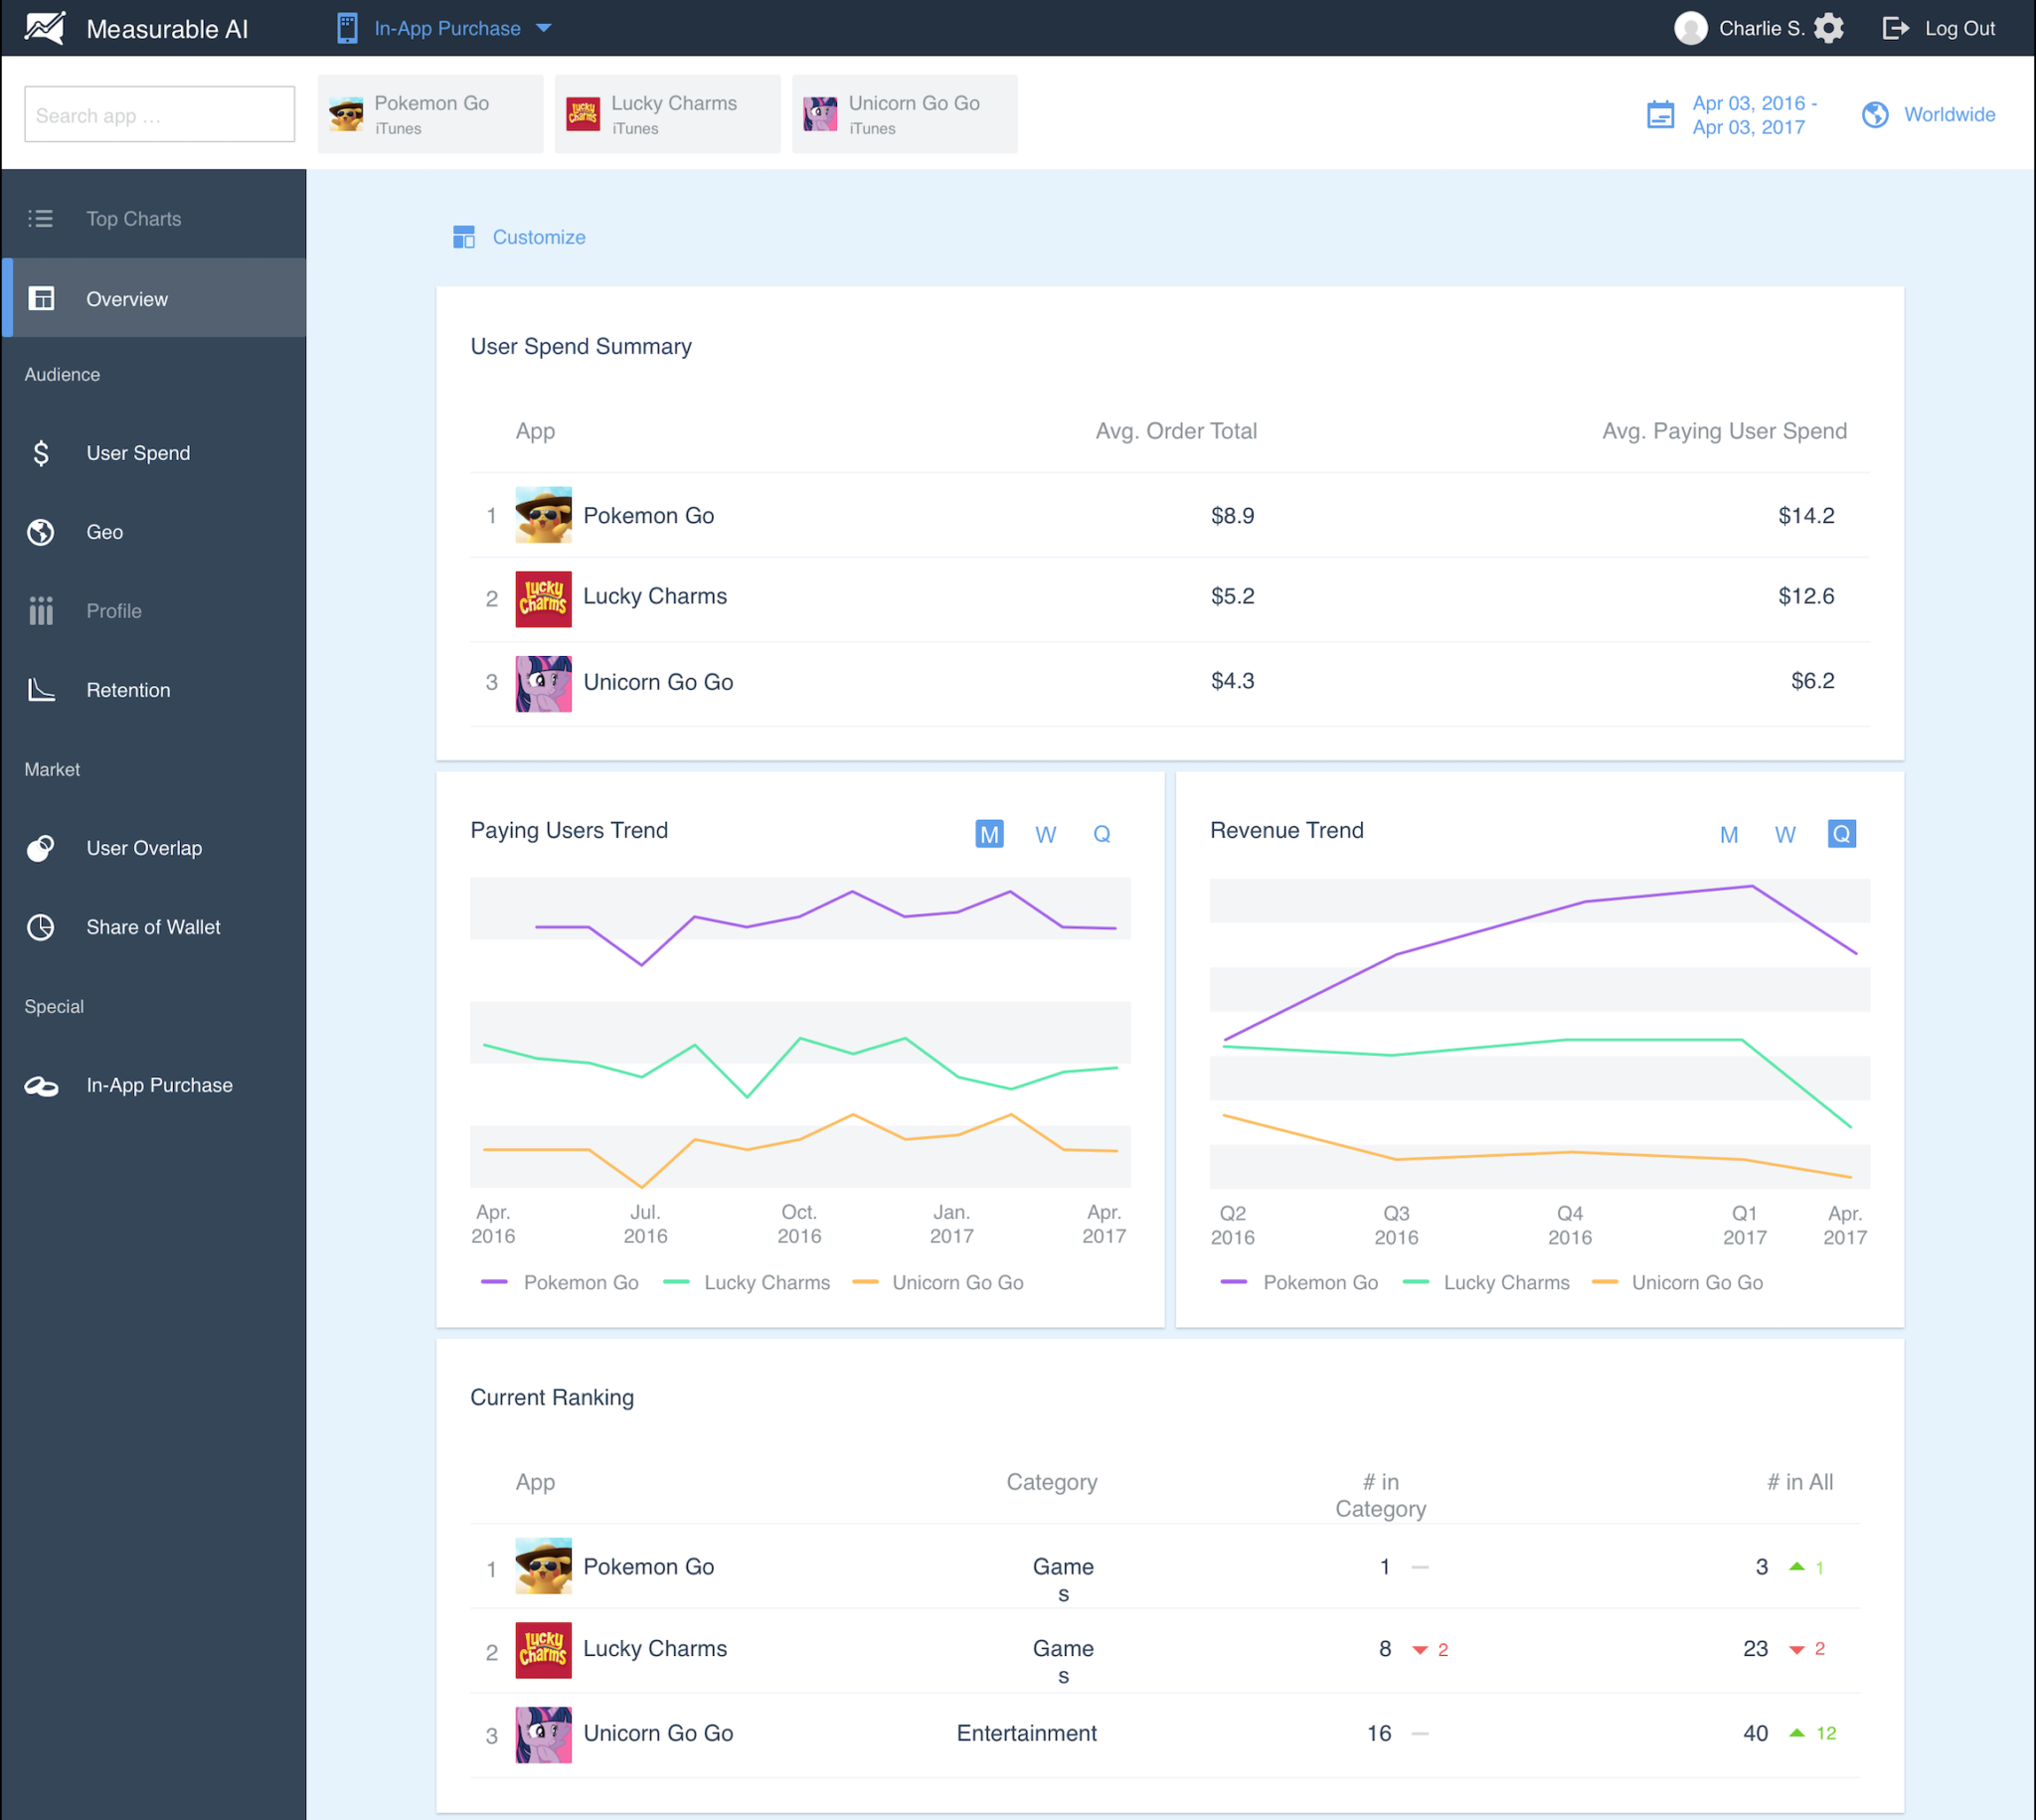
I remembered when we showcased the dashboard feature, one of our clients confessed their biggest struggle was to identify big spenders’ behaviours. According to the client, some big spenders as “whales” only last for a limited time period in one game. As time goes, some big spenders leave the former game and look for the next favorite one.
Our case study wants to help predict possible purchasing patterns of big spenders, but may not yet suffice to predict big spenders’ new interest in new games for the long run. That’s why a data feed updates weekly or even daily is necessary. To help predict more accurately the big spenders’ behavior, other characteristics such as game type, geography, and demographic information may also be helpful to include.
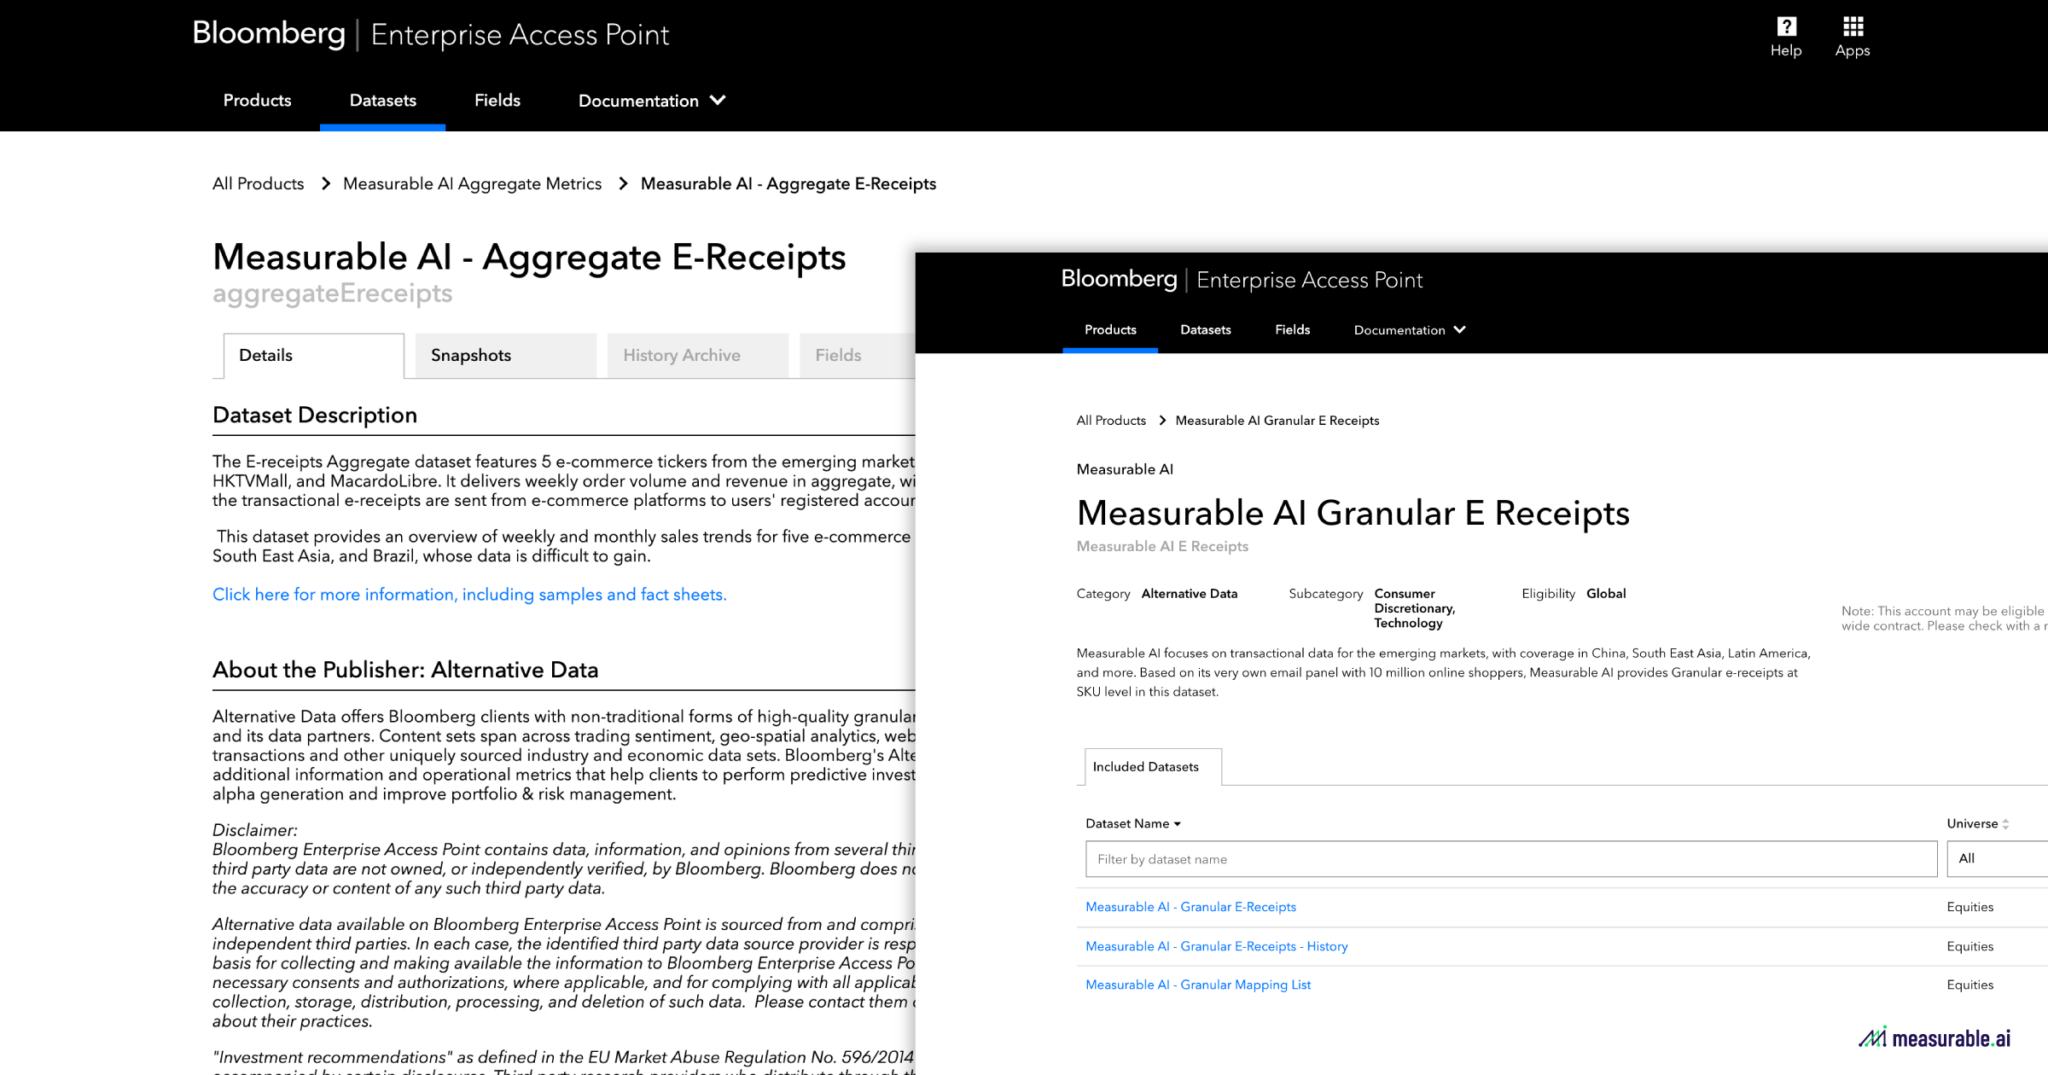
Measurable AI’s In-App-Purchase Datasets are also available as part of an Alternative Data catalog on Bloomberg Enterprise Access Point.
Currently on Bloomberg’s BEAP platform, we offer a granular e-receipts dataset covering 20 tickers out of 50 top mobile apps and games, as well as an aggregated dataset featuring 5 e-commerce tickers from the emerging markets: Shopee, Lazada, Momoshop, HKTVMall, and MacardoLibre.


Sign up to receive our stories in your inbox.
Data is changing the speed of business. Investors, Corporations, and Governments are buying new, differentiated data to gain visibility make better decisions. Don't fall behind. Let us help.


Sign up to receive our stories in your inbox.
Data is changing the speed of business. Investors, Corporations, and Governments are buying new, differentiated data to gain visibility make better decisions. Don't fall behind. Let us help.


