
Modest Weekly Growth Hides Longer-Term Trends
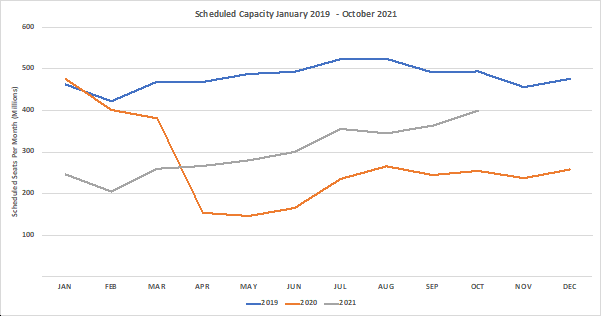
The ups and downs of aviation’s recovery continued this week with capacity increasing back up to 78.9 million seats a week, a modest increase of 0.7% and over half a million seats added. Is that growth cause for optimism? Well, at the beginning of July airlines were planning to operate some 93.3 million seats so reduced operational capacity by some 15% in the space of seven weeks before travel as they matched capacity to available demand. Key markets such as the US, Europe and China to virtually anywhere remain locked with no sign of anyone wishing to reopen their borders.
As we head into September and the summer season slowly sets, airlines will be wondering where the good news really is and what their fortunes will be for this winter; even the US domestic market seems to be stalling as the Delta variant continues to spread across the country. IATA’s expected industry losses for this year are likely to be larger than they expected unless something significant happens soon.
This week’s latest schedule changes through to the end of October saw another 18 million seats removed by airlines around the world from their networks. Every day around 252,000 seats are being removed, and as airline network planners return to work from well-deserved vacations this week we can expect that number to increase in the next few weeks.
Chart 1 – Scheduled Airline Capacity by Month
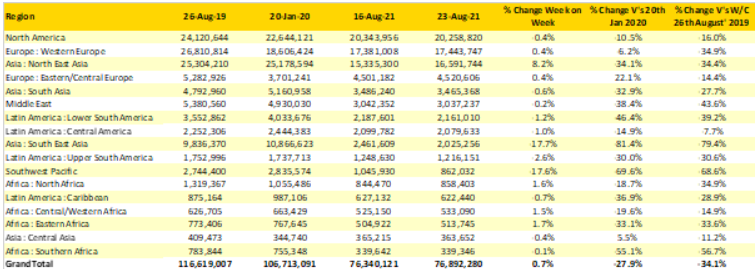
The recovery in this week’s data is based around an 8% increase in capacity across the North East Asia region with all of that increase attributed to growth in China with all of the majors adding back more seats to the market with China Eastern leading that recovery with over 23% capacity growth. Over 1.4 million domestic seats were added week on week whilst international capacity fell slightly, less than 1% of all seats in the Chinese market are allocated to international services; that must change for any recovery to begin.
Sadly, capacity cuts continue in the Southwest Pacific region with domestic capacity in Australia cut by another 22% week on week. In 2019 there were some 1.5 million weekly seats in the Australian domestic market, this week there will be around 480,000 and if that looks bad then international capacity is at less than 15% of its normal levels. New Zealand is equally as grim with just 12% of normal pre Covid-19 international capacity. And of course, in both markets, airlines are operating with selling capacity way below the aircraft’s commercial capacity, thank heavens for cargo!
South East Asia is another market heading in the wrong direction with most major markets reporting declines in weekly capacity. On a more positive note, Singapore, the pioneers of travel bubbles have now come up with Vaccinated Travel Lanes (VTL’s) to replace bubbles with Germany and Brunei the first countries to achieve such designation, let’s hope they are more successful than the bubbles. Domestic capacity in Thailand this week has been cut by around one-third as further outbreaks hit their attempts at a recovery, last week Thai Airways reported that they are working on 600 different projects to reduce the airlines costs!
Table 1– Scheduled Airline Capacity by Region
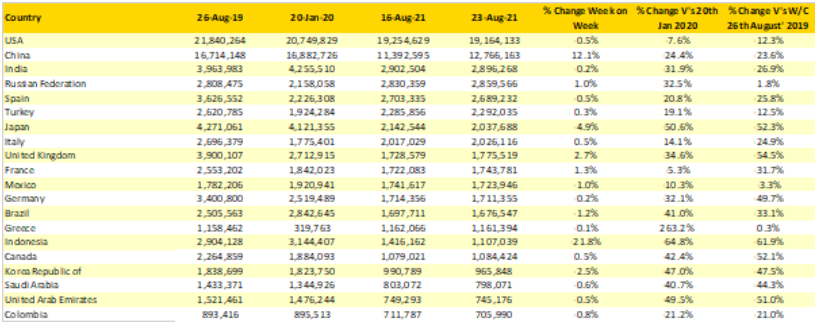
Across the top twenty country markets there is little movement aside from the previously mentioned optimism in China and another reduction in capacity in Indonesia, a market where airlines are chopping and changing capacity every week. Images of Australian nationals being suddenly repatriated from Bali back home last week will have done nothing for consumer confidence in the resort destination and the thought of a 3-week quarantine in Australia will not seem like a holiday for many.
It seems incredible, although equally a reflection on the global impact of the pandemic that eighteen of the top twenty countries in August 2019 are still in the top twenty; the pain has been equally shared across all markets! Only Australia and Thailand have dropped out of the rankings to be replaced by Greece and Colombia both country markets that have perhaps taken a more relaxed approach to travel restrictions.
Table 2- Scheduled Capacity, Top 20 Country Markets
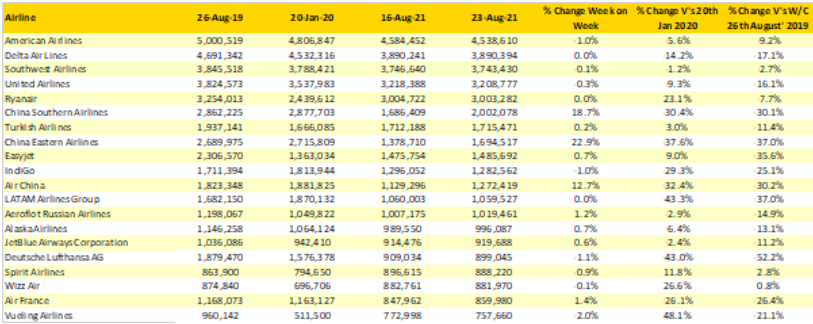
Aside from the Chinese “Big Three” adding back capacity this week, there is little movement amongst the top twenty global airlines with less than a 2% swing either up or down across the remaining carriers. Maybe that is a sign of market stability or perhaps a reflection that no one has a clue about where to add back or remove capacity any longer. Despite a round of CEO optimism in the early part of the summer it seems that the flames of a recovery are fading as quickly as Arsenal’s supporters’ chances of having to buy a Ryanair flight to Europe next year.
Table 3- Top 20 Airlines Capacity
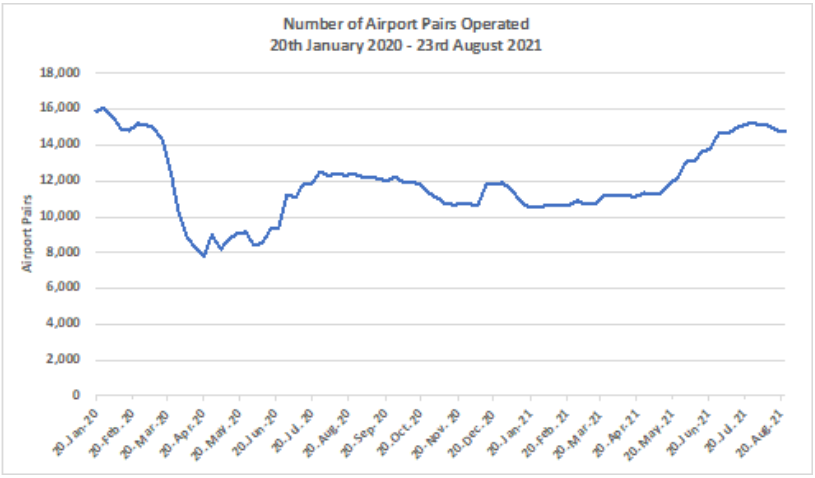
Despite the current trends in many markets being gloomy at best in any data there are always some encouraging points that can be picked out, sometimes you just have to look harder to find those. One of those more optimistic pointers is in the number of airport pairs that are being operated on a weekly basis and how they have recovered through the pandemic. The chart below shows the weekly number of airport pairs being operated; this week’s number stands at 14,744 compared to 15,885 at the beginning of the pandemic, a reduction of just 7% compared to a global capacity reduction of 28%; that’s a positive, isn’t it?
Chart 2 - Operating Airport Pairs
The next few weeks will determine just how good or perhaps more likely 2021 will be for the world’s airlines. A reopening of the US market for Europeans in the next week or so will undoubtedly lead to the normal rush of demand that we have seen in other markets; if it remains closed then for many carriers the forthcoming winter season will be as bad as last year. International capacity to and from China is unlikely to get any better before the early part of 2022, Australia and New Zealand will be based on current vaccination trajectories and public resistance be locked in until the second quarter of 2022. And of course, the UK Government will announce its latest list of red list countries; we shouldn’t expect any common sense to be applied to that update.
To learn more about the data behind this article and what OAG has to offer, visit https://www.oag.com/.


Sign up to receive our stories in your inbox.
Data is changing the speed of business. Investors, Corporations, and Governments are buying new, differentiated data to gain visibility make better decisions. Don't fall behind. Let us help.


Sign up to receive our stories in your inbox.
Data is changing the speed of business. Investors, Corporations, and Governments are buying new, differentiated data to gain visibility make better decisions. Don't fall behind. Let us help.


