Source: https://www.placeiq.com/2022/12/black-friday-spending-gains-far-outpaced-visitation-increases/
In 2022, Black Friday spending increases across retail far surpassed visitation increases. When analyzing this major shopping holiday with data from PlaceIQ, we can see larger basket sizes, higher in-store conversion rates, and pent–up demand for savings drove these spikes.
Black Friday 2021 was very successful compared to 2020; traffic and spend rebounded greatly. This year, we didn’t see the same leaps and bounds, but it was another successful weekend for retailers. Covid is no longer holding us back, but inflation and macroeconomic factors keep things grounded from a year-over-year perspective.
There were a couple of bright spots in year-over-year traffic for Dollar Stores that added new locations, and Beauty Supply retailers benefiting from the “lipstick index” and popularity of an affordable luxury.
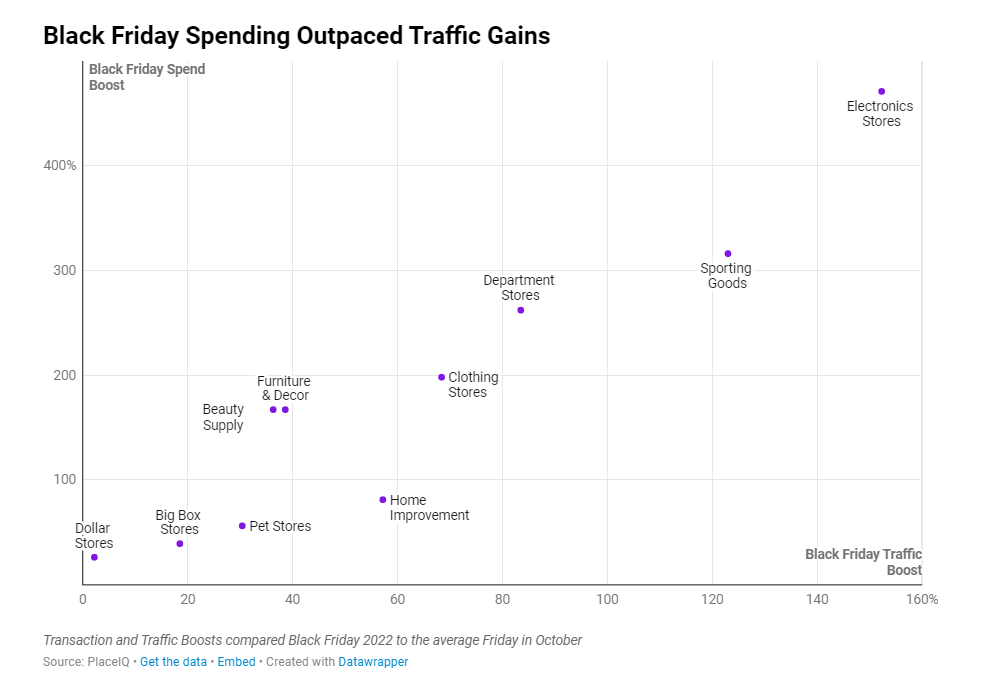
As expected, all major retail categories experienced some traffic increases on Black Friday. The typical discretionary retail locations drew traffic spikes – with Electronics, Sporting Goods, and Department Stores leading the pack. When we add spend to the equation, we can see increases in total spending outpaced foot traffic gains by an average of 2.9x.
Electronics Stores and Department Stores saw some of the highest multipliers (3.1x) when analyzing spend and visitation boosts on Black Friday. In comparison, Hardware Stores scored 1.4x higher spending increases than traffic boosts. Depending on the category, these outliers come from larger shopping baskets and higher in-store conversion rates, or a combination of both.

The average basket value (the size of a single transaction) increased by about 27% on Black Friday compared to a typical Friday. The highest earning households increased their spending at a significantly lower rate compared to other segments. The average transaction for these households jumped 20% compared to the 26%-29% we saw among other lower earners.
Black Friday foot traffic is an effective way to understand brick and mortar holiday performance and demand. Incorporating spend and demographic data helps us illustrate the larger story.
For active campaign optimization and post-holiday analyses, use metrics leveraging various datasets for rich and actionable insights. To message active shoppers with demand for deals, refine targeting by household income and recent activity with audiences from PlaceIQ:
• Recent Retail Shoppers
• Low-Cost Discount Purchasers
• In-Store Retail Shoppers
• Frequent Beauty Supply Store Shoppers
• Income > 50k-75k or 75k-100k
• Retail Shopping Enthusiasts
To learn more about the data behind this article and what PlaceIQ has to offer, visit https://www.placeiq.com/.


Sign up to receive our stories in your inbox.
Data is changing the speed of business. Investors, Corporations, and Governments are buying new, differentiated data to gain visibility make better decisions. Don't fall behind. Let us help.


Sign up to receive our stories in your inbox.
Data is changing the speed of business. Investors, Corporations, and Governments are buying new, differentiated data to gain visibility make better decisions. Don't fall behind. Let us help.


