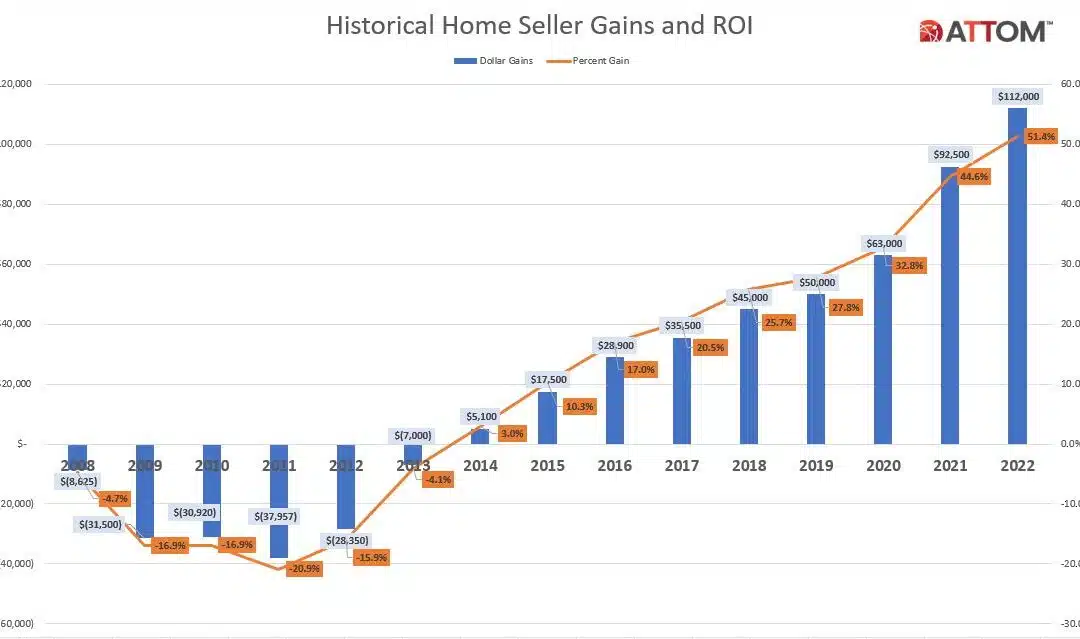
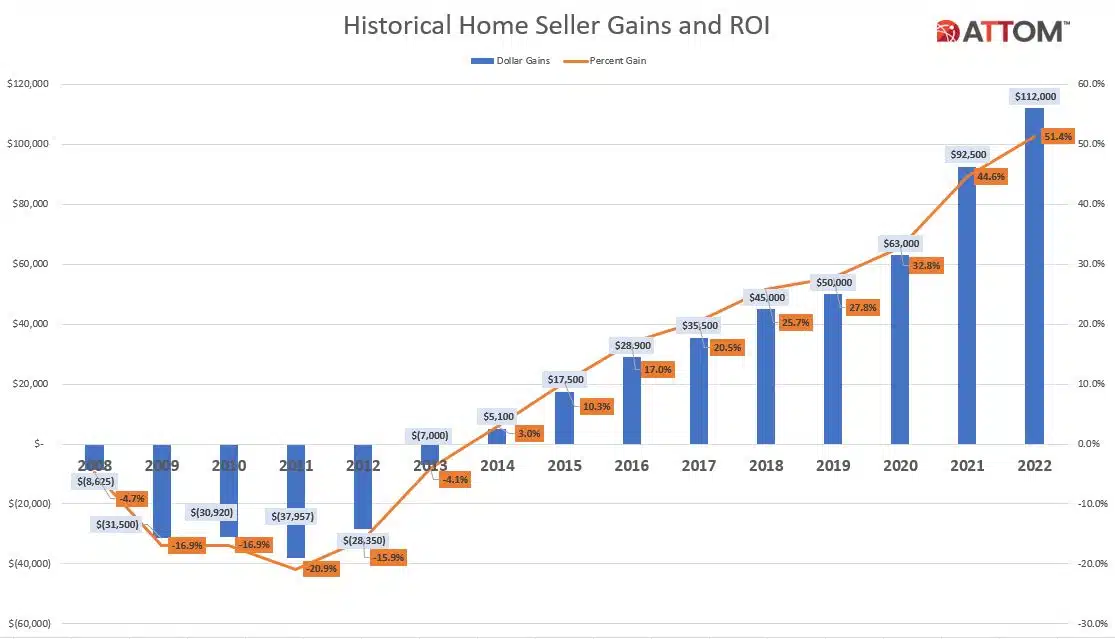
ATTOM, a leading curator of real estate data nationwide for land and property data, today released its Year-End 2022 U.S. Home Sales Report, which shows that home sellers nationwide realized a profit of $112,000 on the typical sale in 2022, up 21 percent from $92,500 in 2021 and up 78 percent from $63,000 two years ago.
Despite a market slowdown in the second half of last year, profits rose from 2021 to 2022 in 98 percent of housing markets with enough data to analyze. The latest nationwide profit figure, based on median purchase and resale prices, marked the highest level in the United States since at least 2008.
The $112,000 profit on median-priced home sales in 2022 represented a 51.4 percent return on investment compared to the original purchase price, up from 44.6 percent last year and from 32.8 percent in 2020. The latest profit margin also represented a high point since at least 2008.
“It seems pretty likely that home seller profits peaked for this cycle in 2022,” said Rick Sharga, executive vice president of market intelligence at ATTOM. “Median prices have declined on a monthly basis since mortgage rates doubled between January and October and are likely to decline further in many markets across the country in 2023, reducing profitability for home sellers.”
Both raw profits and ROI have improved nationwide for 11 straight years, shooting up again in 2022 as the national median home price increased 10 percent to $330,000 – yet another annual record.
At the same time, though, profits increased at a slower pace than in 2021, reflecting a year when the nation’s decade-long housing boom stalled. The national median home value dipped 8 percent over the second half of last year as home-mortgage rates doubled, consumer price inflation soared to a 40-year high and the stock market slumped.
Those forces cut into the amounts potential home buyers could afford, generating multiple headwinds that threaten to further erode the housing market, cutting demand and potentially pushing seller profits down. Total sales last year declined after rising in eight of the previous 10 years.
Among 157 metropolitan statistical areas with a population greater than 200,000 and sufficient sales data, those in western and southern states reaped the highest returns on investment in 2022. The West and South regions had 14 of the 15 metro areas with the highest ROIs on typical home sales last year, led by Hilo, HI (100 percent return on investment); Lake Havasu City-Kingman, AZ (88.4 percent); Spokane, WA (86.2 percent); Fort Myers, FL (85.4 percent) and Port St. Lucie, FL (84.8 percent).
Prices up at least 10 percent in more than half the country as most markets again hit new highs
The U.S. median home price increased 10 percent in 2022, hitting another all-time annual high of $330,000.
The full-year median home-price appreciation in 2022 fell below the 17.6 percent nationwide gain in 2021. Still, the latest increase in the national median value remained among the best over the past decade. Since 2012, when the U.S. housing market was just starting to recover from the Great Recession of the late 2000s, the national median price has grown 120 percent.
Median prices rose from 2021 to 2022 in all but two of the 157 metropolitan statistical areas around the U.S. with a population of 200,000 or more and sufficient home price data in 2022. Values shot up at least 10 percent in 85 of those metros (54 percent). Those with the biggest year-over-year increases were in Florida, led by Naples, FL (median up 26.9 percent); Fort Myers, FL (up 26.7 percent); Lakeland, FL (up 25.7 percent); Port St. Lucie, FL (up 24.6 percent) and Ocala, FL (up 23.8 percent).
The largest median-price increases in metro areas with a population of at least 1 million in 2022 came in Tampa, FL (up 21.9 percent); Raleigh, NC (up 17.9 percent); Austin, TX (up 17.9 percent); Orlando, FL (up 17.7 percent) and Tucson, AZ (up 17.2 percent).
Typical home prices in 2022 reached new peaks in 153 of the 157 metros analyzed (97 percent), including New York, NY; Los Angeles, CA; Chicago, IL; Dallas, TX, and Houston, TX.
Metro areas where median prices dropped in 2022, or rose by the smallest amounts, were Davenport, IA (down 2 percent); Shreveport, LA (down 1.7 percent); Baltimore, MD (up 2.7 percent); Pittsburgh, PA (up 2.7 percent) and Toledo, OH (up 2.8 percent).
Profit margins increase in 90 percent of nation
Profit margins on typical home sales improved from 2021 to 2022 in 141 of the 157 metro areas with sufficient data to analyze (90 percent). That happened as the 10 percent jump in sale prices nationwide in 2022 surpassed the 5 percent increases recent sellers had been paying when they originally bought their homes.
Nine of the 10 largest increases in investment returns were in Florida, led by Fort Myers, FL (ROI up from 51 percent in 2021 to 85.4 percent in 2022); Ocala, FL (up from 49.7 percent to 82.4 percent); Naples, FL (up from 44.7 percent to 74.4 percent); Port St. Lucie, FL (up from 62.8 percent to 84.8 percent) and Miami, FL (up from 42.9 percent of 64.1 percent).
Aside from Miami, the largest ROI gains from 2021 to 2022 in metro areas with a population of at least 1 million were in Orlando, FL (ROI up from 42.2 percent to 62.2 percent); Tampa, FL (up from 53.8 percent to 73.8 percent); Jacksonville, FL (up from 43.7 percent to 58.4 percent) and Las Vegas, NV (up from 48.8 percent to 59.8 percent).
The biggest decreases in investment returns from 2021 to 2022 came in Salem, OR (ROI down from 82.7 percent to 43.1 percent); Atlanta, GA (down from 43.9 percent to 36 percent); Boise, ID (down from 75.9 percent to 68.9 percent); Prescott, AZ, (down from 82.7 percent to 75.9 percent) and Sacramento, CA (down from 61 percent to 54.7 percent).
Aside from Atlanta and Sacramento, metro areas with a population of at least 1 million and declining profit margins in 2022 included Minneapolis, MN (down from 43.8 percent to 40 percent); Los Angeles, CA (down from 48.2 percent to 45.2 percent) and San Francisco, CA (down from 75.2 percent to 72.8 percent).
Raw profits top $100,000 in half the country, with largest clustered on West Coast
Raw profits on median-priced home sales in 2022 topped $100,000 in 79, or 50 percent, of the 157 metro areas with sufficient data to analyze.
The West region had 17 of the top 20 raw profits in 2022, led by San Jose, CA ($621,000); San Francisco, CA ($473,000); Seattle, WA ($304,063); San Diego, CA ($295,500) and Los Angeles, CA ($272,500).
The smallest raw profits in 2022 were mainly in the South and Midwest, reflecting lower homes prices in those areas than elsewhere. Those regions had 19 of the 20 lowest profits on typical sales, led by Columbus, GA ($19,000); Shreveport, LA ($20,000); Beaumont, TX ($22,991); Rockford, IL ($34,500) and Davenport, IA ($38,500).
Home seller tenure remains near 10-year low
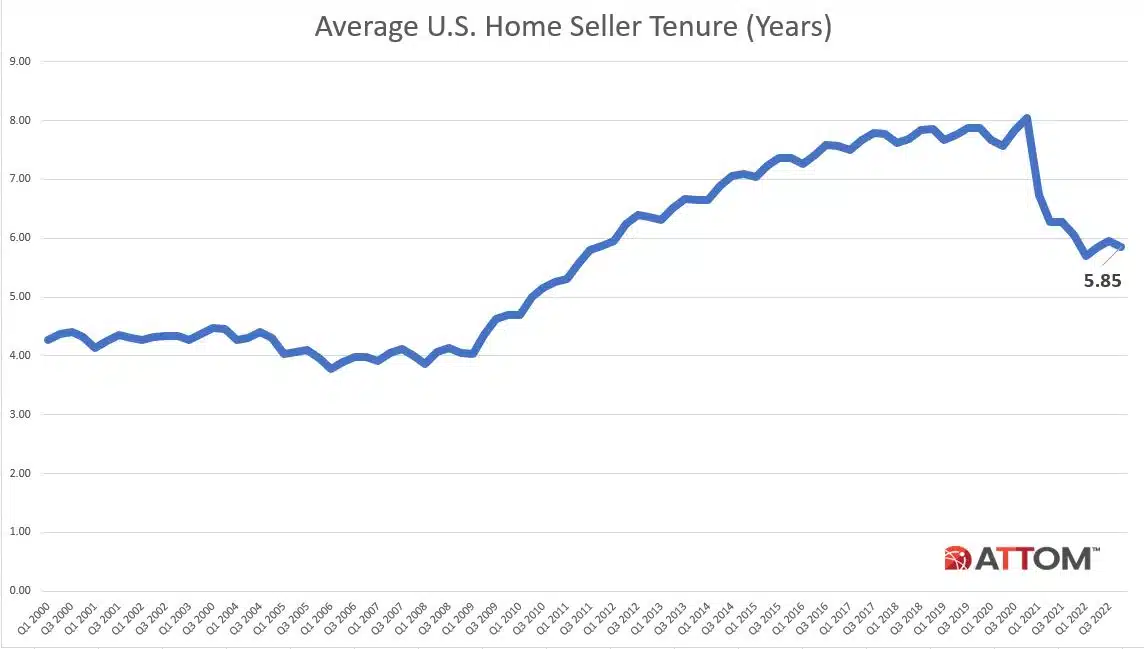
Home sellers in the U.S. who sold in the fourth quarter of 2022 had owned their homes an average of 5.85 years, down from 5.96 years in the previous quarter and from 6.05 years in the fourth quarter of 2021. The latest figure represented the third-shortest average home-seller tenure since 2012. Average seller tenures were down, year over year, in 77, or 72 percent, of the 107 metro areas with a population of at least 200,000 and sufficient data.
The biggest declines in average seller tenure from the fourth quarter of 2021 to the fourth quarter of 2022 were in Rockford, IL (down 23 percent); Atlantic City, NJ (down 22 percent); Dayton, OH (down 20 percent); Knoxville, TN (down 19 percent) and Salem, OR (down 18 percent).
The longest tenures for home sellers in the fourth quarter of 2022 were in Bellingham, WA (9.87 years); Manchester, NH (8.58 years); Honolulu, HI (8.38 years); Bridgeport, CT (7.78 years) and New Haven, CT (7.57 years).
Cash sales at nine-year high
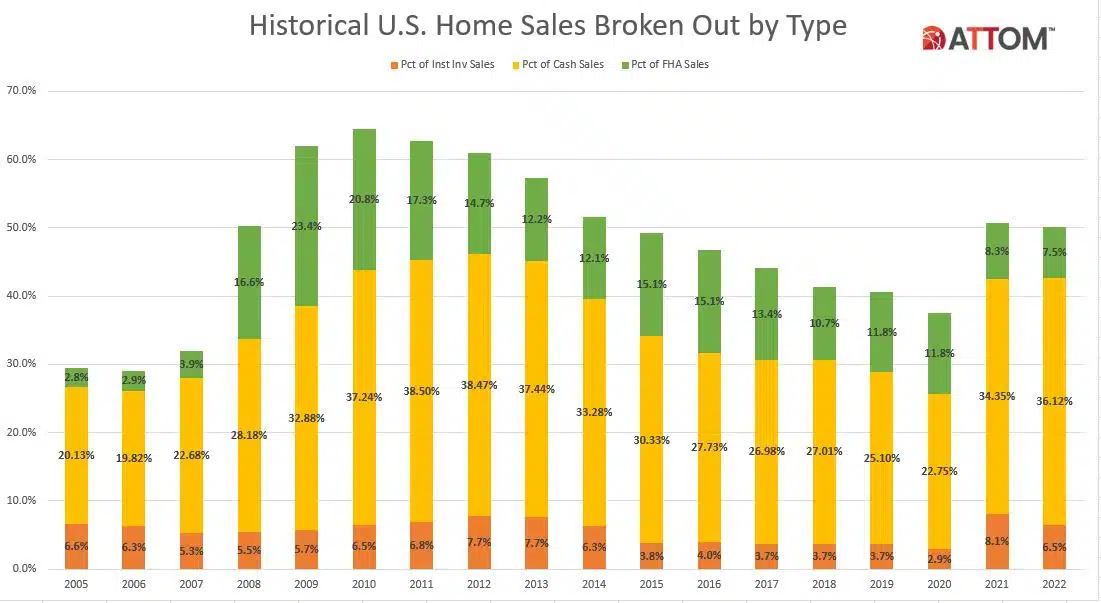
Nationwide, all-cash purchases accounted for 36.1 percent, or one of every three single-family home and condo sales in 2022. The latest percentage – the highest since 2013 – was up from 34.4 percent in 2021 and from 22.7 percent in 2020, although still off the 38.5 percent peaks in 2011 and 2012.
“Cash buyers – many, but not all of whom are investors – are in a position of competitive advantage in today’s higher interest rate environment, and will continue to account for a higher-than-usual share of market at least until mortgage rates dip back down a bit,” Sharga noted. “With affordability a problem for many buyers – especially first-time buyers – it wouldn’t be a surprise to see the percentage of cash purchases actually increase in 2023.”
Among those metropolitan statistical areas with a population of at least 200,000 and sufficient cash-sales data, those where cash sales represented the largest share of all transactions in 2022 were Augusta, GA (72.1 percent of sales); Columbus, GA (69 percent); Athens, GA (60.6 percent); Flint, MI (59.5 percent) and Gainesville, GA (58.9 percent).
Lender-owned foreclosure purchases in U.S. at lowest level in at least 17 years
Foreclosure sales to lenders accounted for just 1.2 percent, or one of every 87 single-family home sales in 2022 – the lowest level since at least 2005. The 2022 figure was down from 1.5 percent of sales, or one in 68, in 2021 and 3.6 percent, or one in 28, in 2020.
States where lender-purchased (REO) foreclosure sales comprised the largest portion of total sales in 2022 were Michigan (3.2 percent of sales), Illinois (3 percent), Connecticut (2.2 percent), New York (1.9 percent) and Arkansas (1.9 percent).
Among 156 metropolitan statistical areas with a population of at least 200,000 and sufficient data, those where lender-purchased foreclosure sales represented the largest portion of all sales in 2022 were Flint, MI (8.3 percent of sales); Binghamton, NY (4.9 percent); Kalamazoo, MI (4.6 percent); Lansing, MI (4.5 percent) and Huntington, WV (3.7 percent).
Among 55 metropolitan statistical areas with a population of at least 1 million, those with the highest levels of lender-purchased foreclosures in 2022 were Chicago, IL (2.8 percent of sales); St. Louis, MO (2.4 percent); Detroit, MI (2.1 percent); Grand Rapids, MI (2 percent) and Baltimore, MD (2 percent).
Those with the smallest shares were Raleigh, NC (0.2 percent of sales); Denver, CO (0.2 percent); Tucson, AZ (0.3 percent); San Francisco, CA (0.3 percent) and Colorado Springs, CO (0.3 percent).
Aside from Raleigh, Denver, Tucson and San Francisco, metro areas with at least 1 million people where lender-purchased foreclosures represented the smallest share of total sales also included Phoenix, AZ (0.3 percent).
Institutional investing down in 2022
Institutional investors nationwide accounted for 6.5 percent, or one of every 15 single-family home and condo sales in 2022 in the U.S. The latest figure was down from 8.1 percent in 2021, but was still more than twice the 2.9 percent level in 2020.
Among those metropolitan statistical areas with a population of at least 200,000 and sufficient institutional-investor sales data, those with the highest portions of institutional-investor transactions in 2022 were Atlanta, GA (19 percent of sales); Memphis, TN (18.4 percent); Jacksonville, FL (17.9 percent); Charlotte, NC (16.8 percent) and Tucson, AZ (16.6 percent).
FHA sales at lowest point in 15 years
Nationwide, buyers using Federal Housing Administration (FHA) loans accounted for 7.5 percent, or one of every 13 single-family home and condo purchases in 2022. That was down from 8.3 percent in 2021 and from 11.8 percent in 2020, to the lowest point since 2007.
Among those metropolitan statistical areas with a population of at least 200,000 and sufficient FHA- buyer data in 2022, those with the highest share of purchases made with FHA loans were Bakersfield, CA (18.9 percent of sales); Visalia, CA (18.3 percent); Merced, CA (17.7 percent); Hagerstown, MD (15.8 percent) and Modesto, CA (15.6 percent).
To learn more about the data behind this article and what Attom Data Solutions has to offer, visit https://www.attomdata.com/.


Sign up to receive our stories in your inbox.
Data is changing the speed of business. Investors, Corporations, and Governments are buying new, differentiated data to gain visibility make better decisions. Don't fall behind. Let us help.
Sign up to receive our stories in your inbox.
Data is changing the speed of business. Investors, Corporations, and Governments are buying new, differentiated data to gain visibility make better decisions. Don't fall behind. Let us help.