Earnest continues to monitor consumer behavior as state economies reopen across the country. In this refresh, we look at state performance in the context of stay-at-home orders expiring, foot traffic divergences across categories, a Texas drill-down, and how spending by channel is behaving in a staggered reopened economy.
Key Takeaways
A Staggered Reopening
Nationally, spending growth* has improved from the 33% YoY declines in late March to 15% YoY declines as of last week. Looking at the top twenty states in the spend data, the states reviving the fastest include South Carolina, Tennessee, and Arizona; the slowest include D.C., Nevada, and Massachusetts. D.C. has yet to see any improvements, although the fact that it is primarily a work destination for neighboring residential areas may explain its continued consumer absence. Nevada’s over-representation in leisure may explain its slower performance as well.

Looking at the same analysis across all states with expired stay-at-home orders**, we looked at YoY performance subsequent to each state’s stay-at-home order expiration date in order to understand its potential impact on performance. (See next chart for the list of states with expired stay-at-home orders in descending order of YoY performance in the most recent week.)
Understandably, states whose stay-at-home order expired earlier are generally outperforming. However, there are some noteworthy exceptions: Texas, Georgia, and Colorado’s stay-at-home orders all expired before May 1st, yet they are not among the top performing states. Additionally, Nevada’s stay-at-home order officially expired on May 9th, yet it is among the slowest performing states, likely due to its heavy leisure exposure as mentioned above.

Foot Traffic Regression
In our foot traffic data, we saw similar improvements nationally, though the week ending May 16th showed the first WoW deceleration in eight weeks since the crisis began. Meanwhile, YoY foot traffic declines improved only modestly relative to prior weeks. We note that this activity is consistent with trends generally observed at the beginning of a month, which coincides with paycheck deposits. However, it is nevertheless interesting that cyclical behavior would begin to show this early within a long-term secular improvement trend.
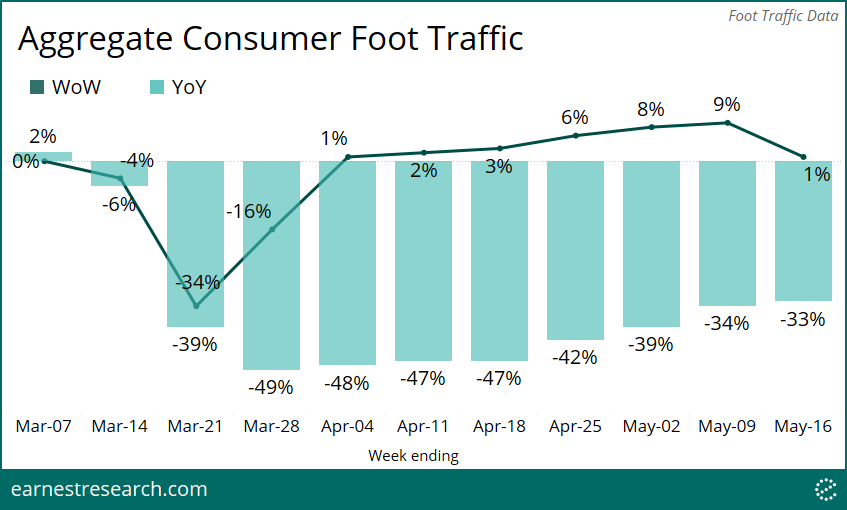
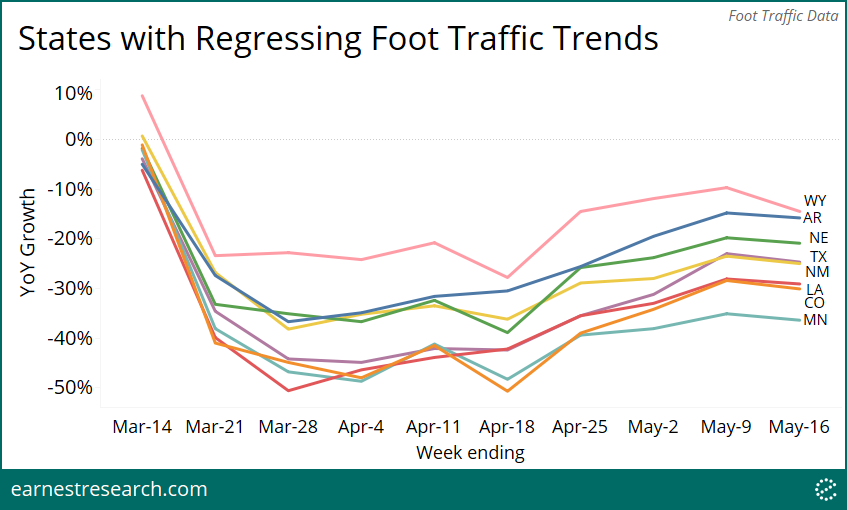
While the vast majority of states saw their rate of improvement slow down in the most recent week, the national deceleration is being led by eight states who saw their YoY trends actually regress. Many of these states were among the earliest to reopen, including Texas and Colorado, or those that never had stay-at-home orders to begin with, including Arkansas, Nebraska, and Wyoming.
Texas Drill Down
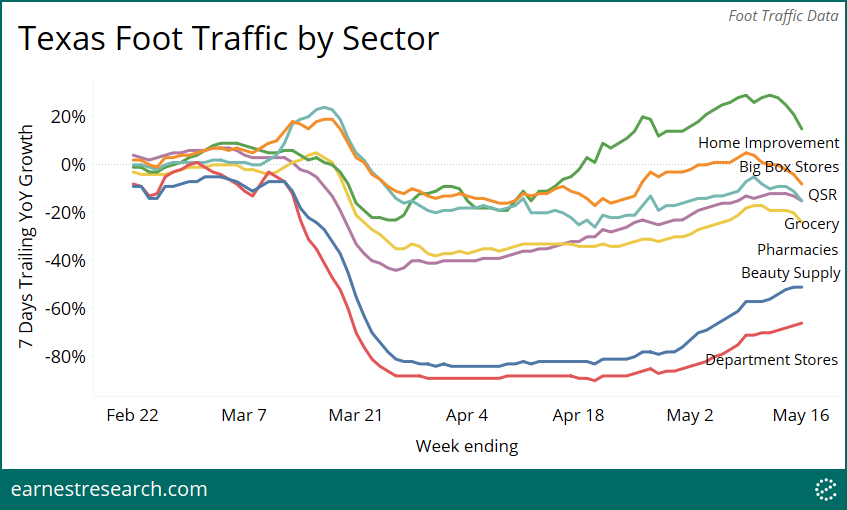
Zooming in on one of the regressing states, Texas, the deceleration appears to be driven by a slowdown of some of the fast-growing essential sectors, notably Home Improvement, Grocers, and Big Box Stores. On the flip side, sectors that are reopening, like Beauty Supply and Department Stores, continue to improve.
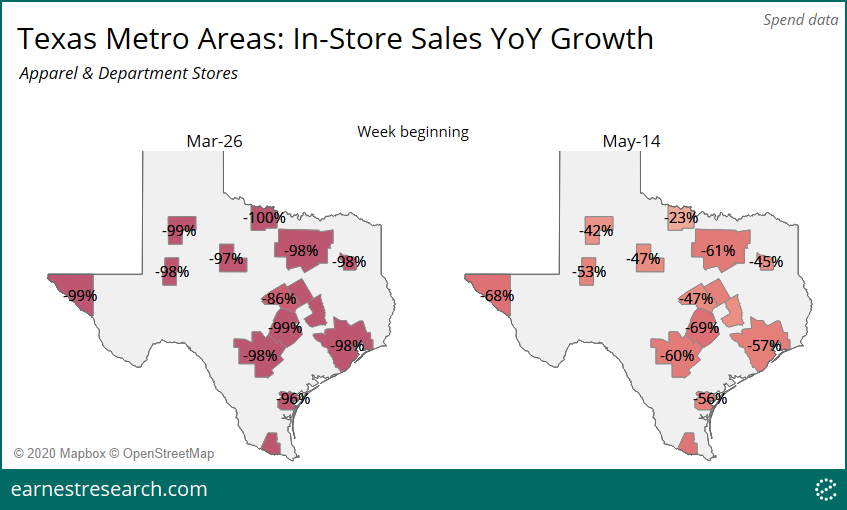
Drilling further into Texas’ top 15 CBSAs, there’s a layered story of local disagreement around brick and mortar reopenings. Looking at Apparel and Department Stores specifically, after ~100% declines at trough, the larger cities (San Antonio, Dallas, Houston, Austin, Kileen, El Paso) have improved to ~60% to 70% YoY declines, underperforming the rest of the state’s ~50% or better. Among the largest cities, Austin and Houston are a full 12 percentage points apart; the former declining 69% and the latter declining 57%.
Channel Behavior
As we noted in Part 1 of our analysis, the states that reopened first generally outperformed the states that only recently reopened. This outperformance primarily manifested in brick and mortar spending at Restaurants, Home, just recently in Apparel, and to a large degree in Hobbies/Toys & Sporting Goods. In the online channel, outperformance was understandably more manifest in sectors most impacted by lockdown, primarily with Restaurants and Apparel, and briefly in Home.
There was minimal difference in channel spending among the two state groups in the ‘essential’ Grocers & General Merchandise categories, and in the virtually non-existent Leisure category. The only category in which the growth in early reopened states continues to underperform the growth in recently reopened states is in the Grocers & General Merchandise online channel, a reflection of continued lockdown behavior in the recently reopened states.
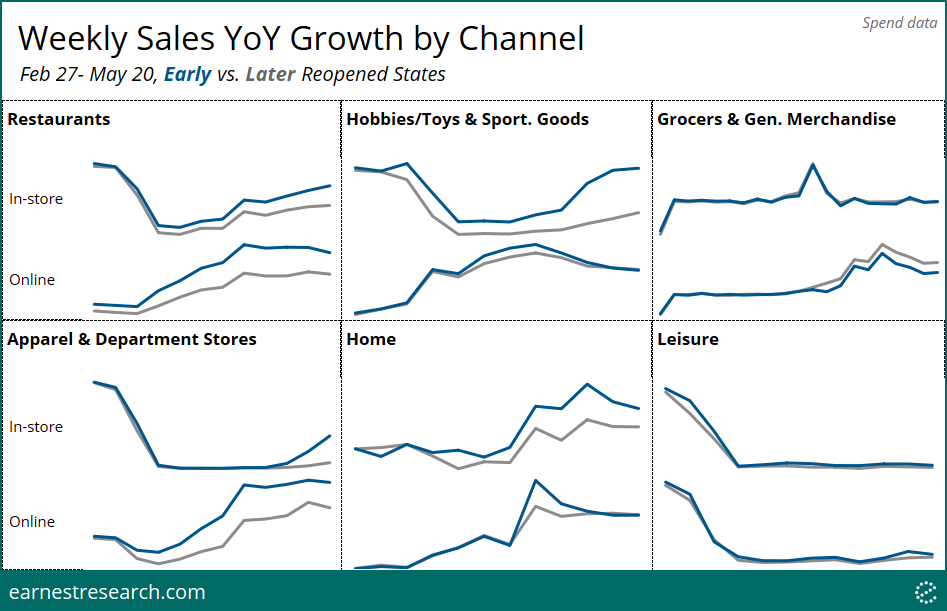
Early defined as states whose stay-at-home order expired on or before May 9th.
Notes
*This analysis shows total consumer spending as a measure of total sales observed in the panel. Our prior piece included a similar chart but was based on the total number of transactions [vs. sales] observed in the panel.
**Stay-at-home order expiration dates were sourced from this New York Times piece.
To learn more about the data behind this article and what Earnest Research has to offer, visit https://www.earnestresearch.com/.


Sign up to receive our stories in your inbox.
Data is changing the speed of business. Investors, Corporations, and Governments are buying new, differentiated data to gain visibility make better decisions. Don't fall behind. Let us help.


Sign up to receive our stories in your inbox.
Data is changing the speed of business. Investors, Corporations, and Governments are buying new, differentiated data to gain visibility make better decisions. Don't fall behind. Let us help.