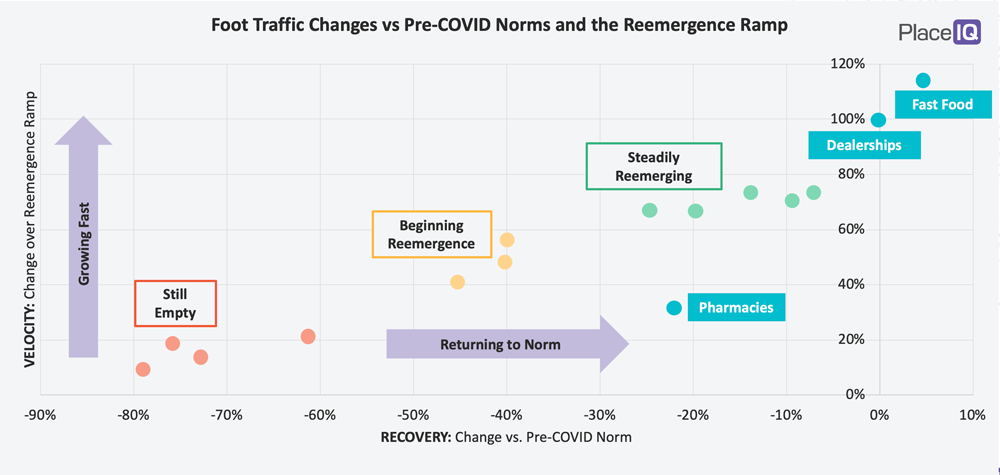
When looking at velocity and recovery, most categories fit neatly into three clusters. Those locations still empty included Entertainment, Offices, Airports; those beginning reemergence included Shopping Malls and Hotels; and those steadily reemerging included Fast Casual Dining and Coffee Shops. However, there were a couple outliers – and one category we’ve found intriguing is Auto. Today, we’ll be looking at Auto’s unique visitation trends, and what we can expect from their recovery.

In this graphic, we’ve segmented categories by their recovery and velocity to illustrate how far away a category is from its pre-COVID norms, and how quickly it is approaching that recovery. With this visualization our metrics correlate very well and our categories cluster nicely – except for fast food restaurants, auto dealerships, and pharmacies. These businesses are outliers.
We have our theories on fast food. It’s easy, affordable, and safe to visit for drive through or pick up. Pharmacies are making their way back, slowly, as people prioritize necessities.
So, we asked the question: what’s going on with auto dealerships?
The Continued Reemergence of Dealerships
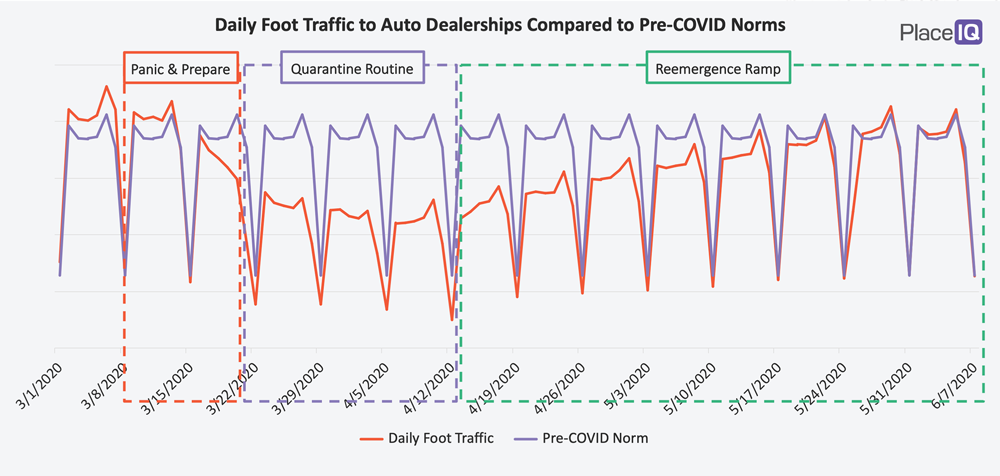
Dealership foot traffic growth is not stopping:

In our discussions with auto business experts, we are seeing support for several factors driving this resurgence:
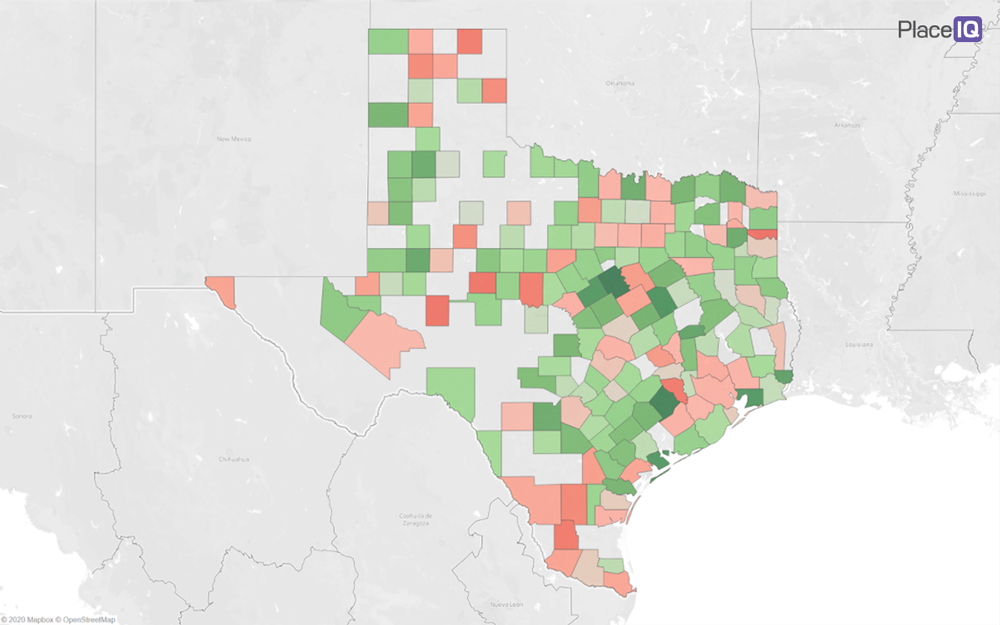
The big question on our minds is if this traffic growth will continue, stall, or decline as immediate demand is flushed from the market. We believe that demand will continue in the short term, as this growth varies significantly by county. For example, here is Texas:


Green counties have positive year-over-year foot traffic figures while red counties have negative figures. Urban areas have less foot traffic, overall, when compared to rural counties. If our #2 and #3 theories for resurgence (avoidance of public transit and local vacation plans) are correct, we expect demand to continue to manifest especially in urban areas. We will continue to monitor this trend to validate our theories.
Monitoring reemergence at the local level will help auto brands understand where traffic is coming back, and how to focus their messaging. We know that reemergence is regional and varies significantly by county. The category charts we’ve shared, breaking down recovery and velocity, largely take the same varied shape from region to region. But this Auto analysis brings into sharp focus that the magnitude of each metric will continue to vary significantly when we get down to local levels. Construct national strategies at your own peril.
To learn more about the data behind this article and what PlaceIQ has to offer, visit https://www.placeiq.com/.


Sign up to receive our stories in your inbox.
Data is changing the speed of business. Investors, Corporations, and Governments are buying new, differentiated data to gain visibility make better decisions. Don't fall behind. Let us help.


Sign up to receive our stories in your inbox.
Data is changing the speed of business. Investors, Corporations, and Governments are buying new, differentiated data to gain visibility make better decisions. Don't fall behind. Let us help.