Weather Analysis for the Amazon Basin: Colombia, Peru, Bolivia, and Brazil
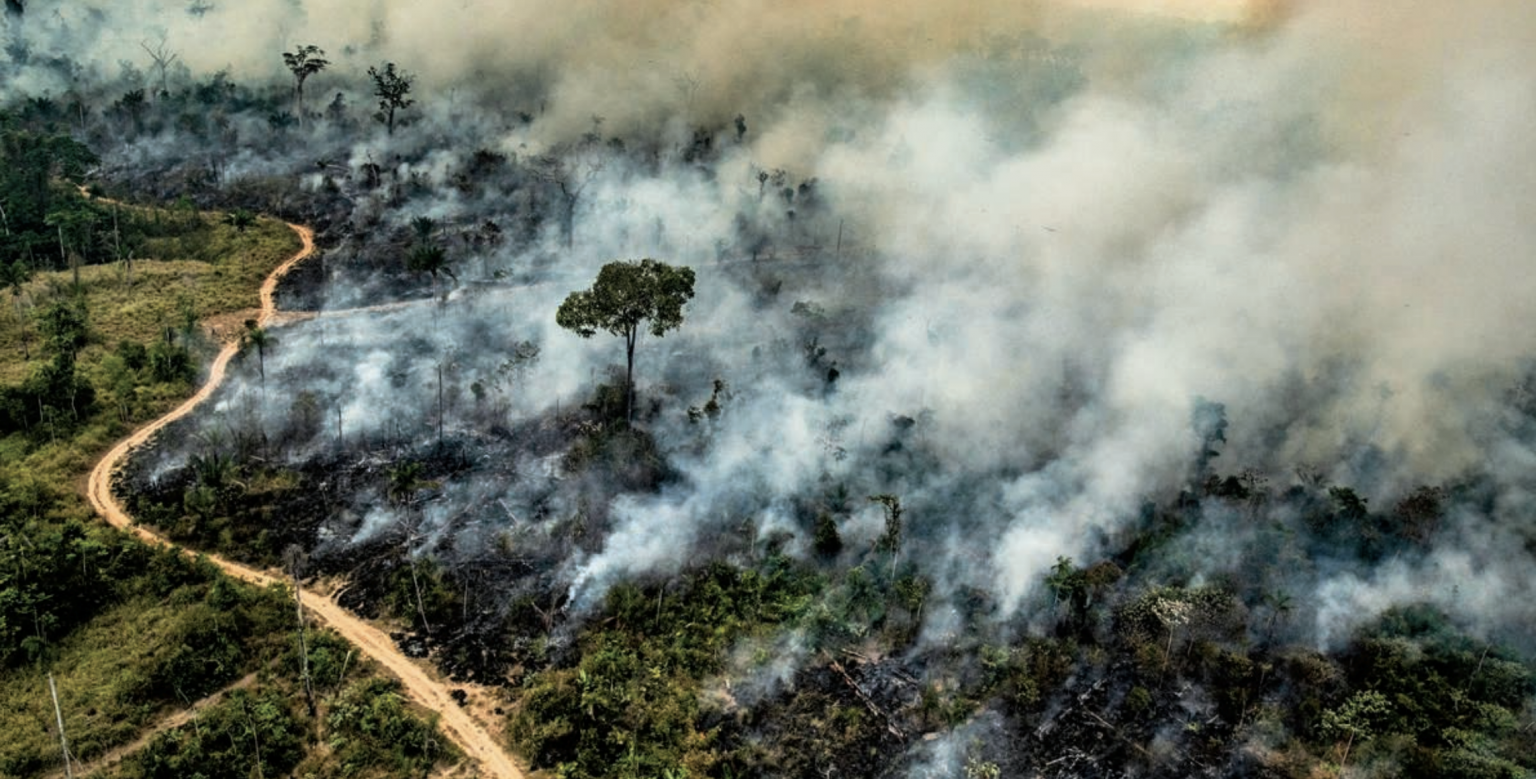
The fires in 2019 caused immense damage across the Amazon Basin. A combination of fires being set to clear land for cattle and environmental factors that caused the fires to spread during the tropical dry season (June-December) destroyed millions of hectares of forest. What is making these fires more dangerous are the drying trends in the region. aWhere’s analysts reviewed the 2020 rainy season to provide an outlook on what might be in store for the dry season and potential fire risk and checked out what happened in 2019.
Review of 2019: How dry was it?
aWhere’s data show that the Precipitation / Potential Evapotranspiration (P/PET), which is an excellent indicator of water availability to support vegetation, was below 1.0 in many areas that experienced fires in 2019. If P/PET is less than 1.0, this means that the evaporative demand of the environment (PET) is greater than precipitation which leads to water stressed vegetation and fire risk. The map of P/PET in May 2019 (below) compares a map of the fire locations to some of the driest areas in the region.
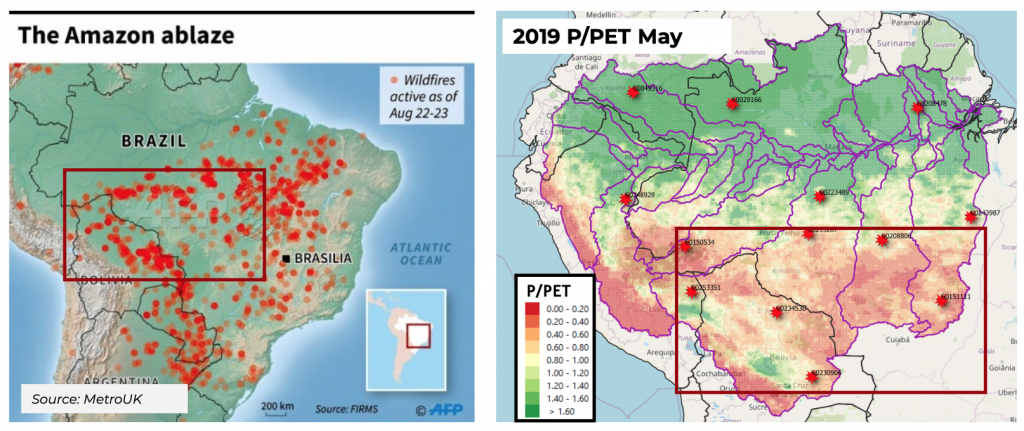
Rainfall is usually quite high but our analysis of P/PET in 2019 shows a stark increase in water stress for forests in the western Amazon basin. This should have alerted policy makers to be aggressive in fire-prevention policies in 2019 and needs to happen in 2020.
Rainfall over the Amazon basin was again much lower than expected in 2020
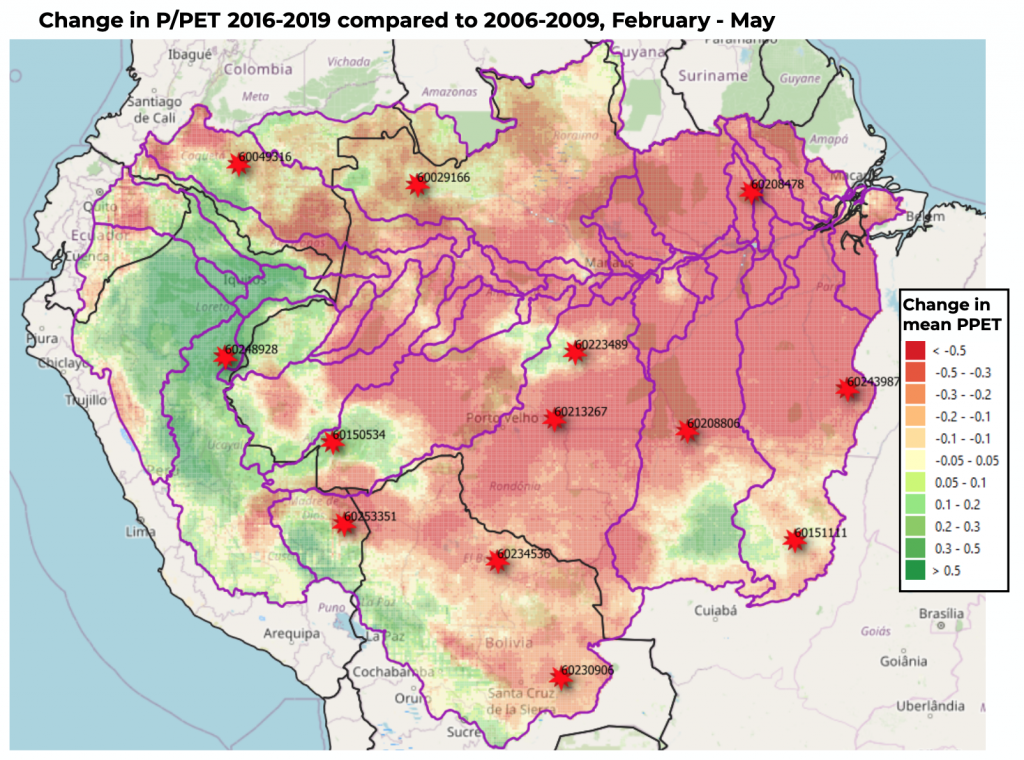
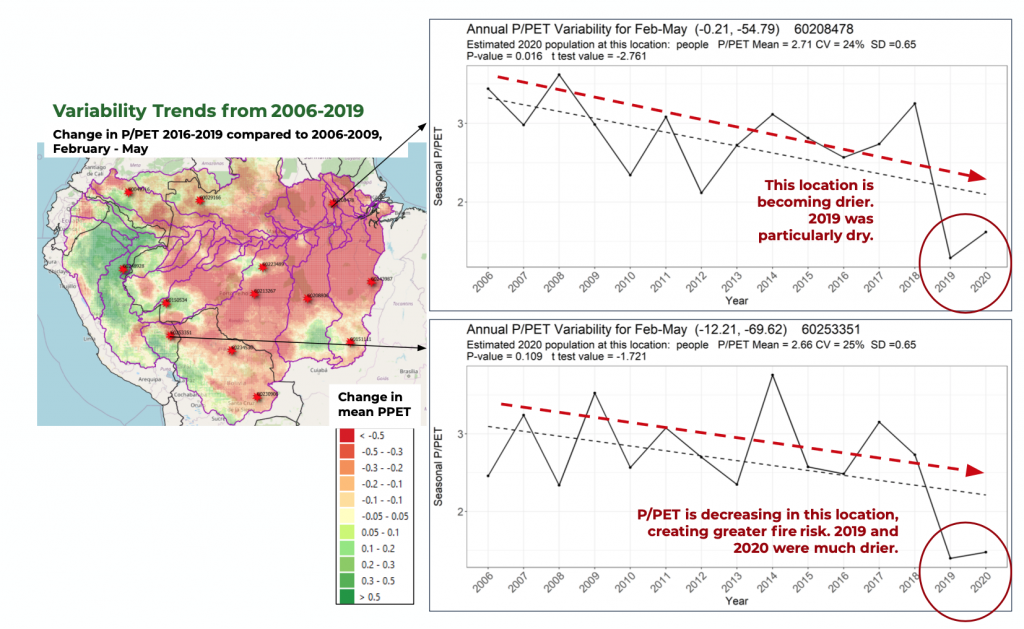
With the dry season approaching, fire risk is again very high. After one of the driest rainy seasons in recent years, the soil in Amazonia is drier and the temperatures higher than normal — the perfect conditions for wildfires. This drying trend is not new, the last 4 years have been much drier during February to May than the same months for a decade ago. This explains the increased frequency and intensity of fires last year. The map below shows this change using an important variable, the Precipitation over Potential Evapotranspiration (P/PET) for the Amazon Basin. Much of the map shows negative changes meaning these areas are getting drier.
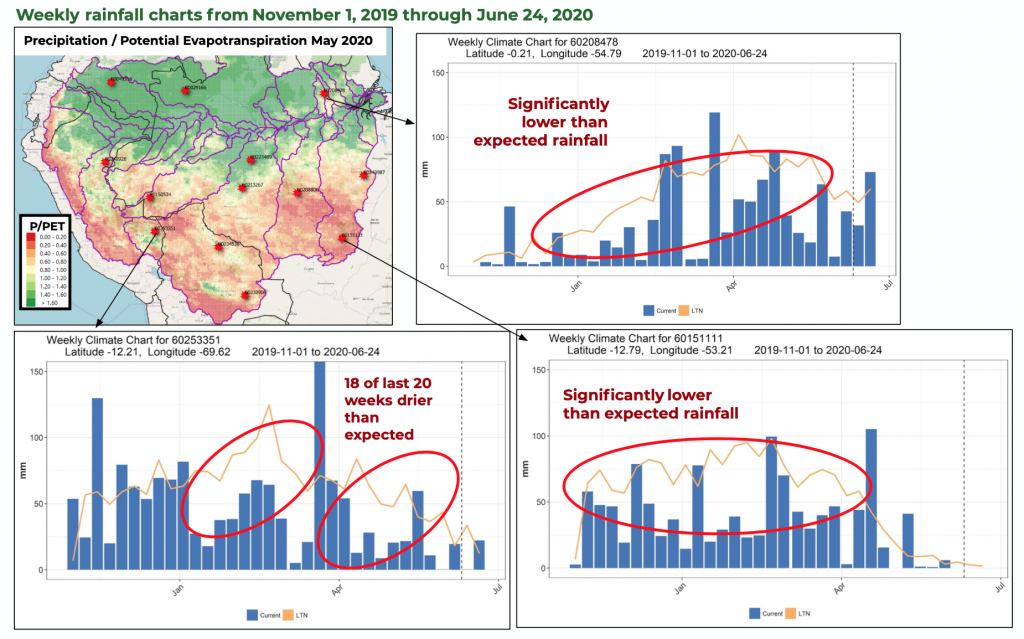
Additionally, when looking at the month of May 2020 (map below), there are many areas that were quite dry during the end of the rainy season. When P/PET is less than 1.0, this means that the evaporative demand of the environment (PET) is greater than precipitation which leads to water stressed vegetation and fire risk. The weekly rainfall charts shown below reflect the progression of the rainy season in certain latitudes/longitudes across the Amazon Basin. These charts are showing much drier than normal conditions, the weekly rainfall totals (blue bars) rarely total the long-term normal averages for these locations (orange line). This points to a significant risk for wildfires and the need for a proactive policy stance to better manage natural resources such as watershed management and no-burn bans to preserve the Amazon.
The charts below show the yearly averages for P/PET in select locations that point to a decline in precipitation coupled with increased variability. As mentioned above, Precipitation / Potential Evapotranspiration (P/PET) is an excellent indicator of water availability to support vegetation. Normal P/PET is > 2.0 and in 2019 and in 2020, for the whole rainy season, P/PET was closer to 1.5. The charts above and below point to drying trends, which could increase the risks associated with fires.
Recommendations
Accurate observed weather data is critical in taking proactive policy and management steps to reduce wildfires. aWhere’s historical data can help decision makers identify areas at risk and pragmatically act on these insights to save millions of hectares of forest.
To learn more about the data behind this article and what aWhere has to offer, visit https://www.awhere.com/.


Sign up to receive our stories in your inbox.
Data is changing the speed of business. Investors, Corporations, and Governments are buying new, differentiated data to gain visibility make better decisions. Don't fall behind. Let us help.


Sign up to receive our stories in your inbox.
Data is changing the speed of business. Investors, Corporations, and Governments are buying new, differentiated data to gain visibility make better decisions. Don't fall behind. Let us help.