
After what seemed like weeks of steady progress, it’s been disheartening to observe the rapid rise of COVID-19 in many regions. As a result, many reopening plans are being slowed or modified to hopefully mitigate the virus’ current trajectory.
But unlike the initial spread — where travelers between cities, counties, and states carried cases far and wide — we’re seeing localized outbreaks. In California, cases are up, but they are largely driven by a handful of counties. We’ve also seen in our data that many people are traveling less and staying closer to home, which creates highly local traffic patterns with less regional exchange. Hopefully these mobility indicators help mitigate further spiking.
As new data arrives, we’ll see if and how the latest rise tamps down foot traffic in the coming days.
Today, we’re going to continue to review what reemergence has looked like so far. It’s even more complex than we had previously stated: traffic recovery is varying by region not just by the amount of recovery but by the speed and direction of change.
Reemergence is Regionally Complex
When we last checked on foot traffic reemergence, we identified three clear cohorts of business categories:
With an additional week of data we can see major gains from the second group, businesses which had just begun reemergence. Mall traffic and nightlife, in particular, have stepped up to mix with the steadily reemerging set. Overall, traffic is dramatically up for both groups two and three over the last month.
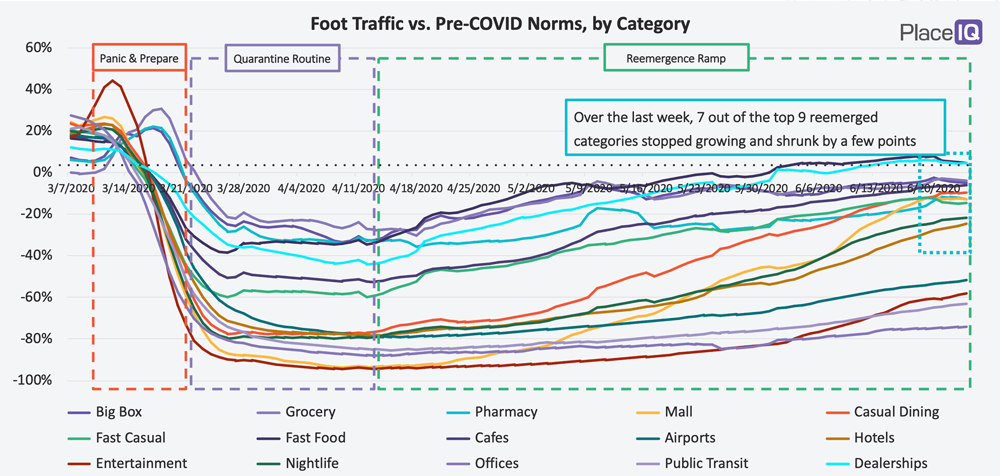
However, there is a ton of variety hiding in the average here. Nationally, traffic is massively up, but at the county level it’s mixed.
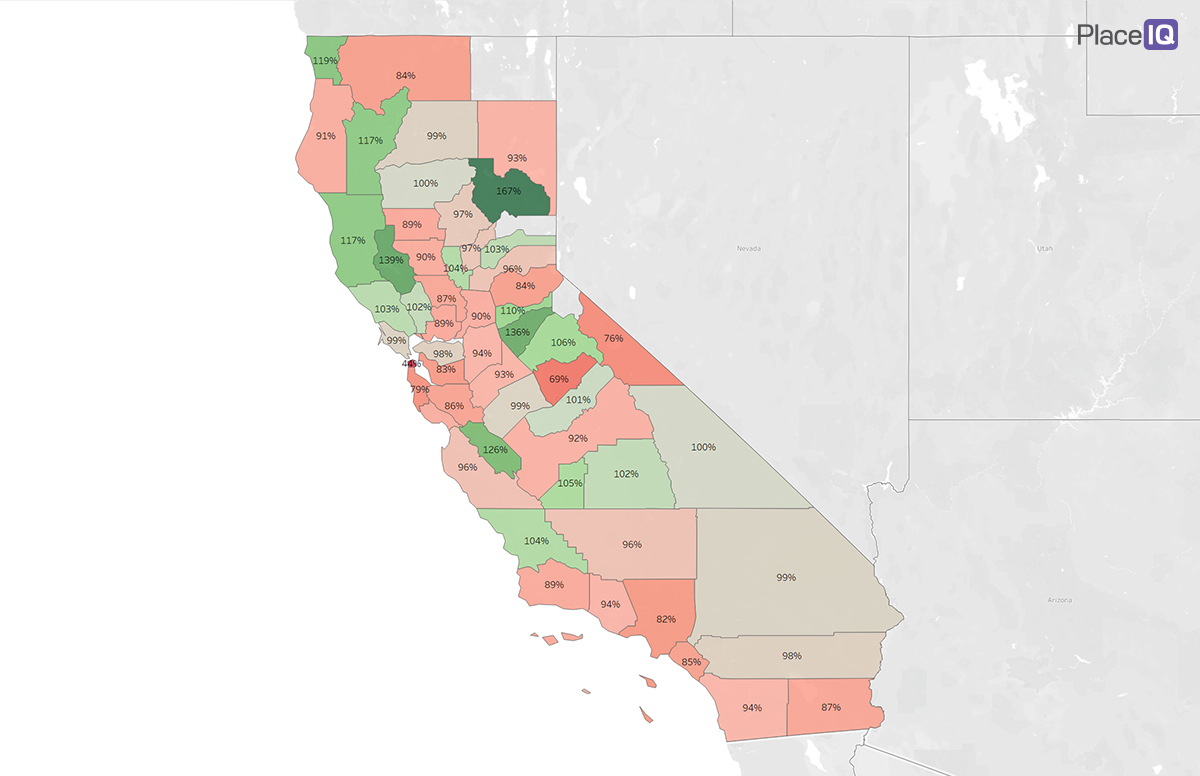
Fast food, for instance, is up nearly 10% nationally compared to pre-COVID norms. Looking at counties just in California, we can see most are still below pre-COVID norms:
Week of 6/22/20
Across the nation, the picture is similarly mixed.
If you’ve read a few of these newsletters, you’re more than familiar with our maxim that reemergence is regional. We’ve looked at similar breakdowns to show how previously common geographies no longer move together, behaviorally. But as we accrue more data, we’re learning that the data varies significantly over time as well. Let’s compare the heatmap above with a snapshot from 4 weeks prior:
Year Over Year Fast Food Traffic Changes Over Time

In most cases, California counties grew their fast food foot traffic. But the amount of growth varied highly as shown above. For a different visual comparison easier on the eyes, let’s show the change over those four weeks by county:
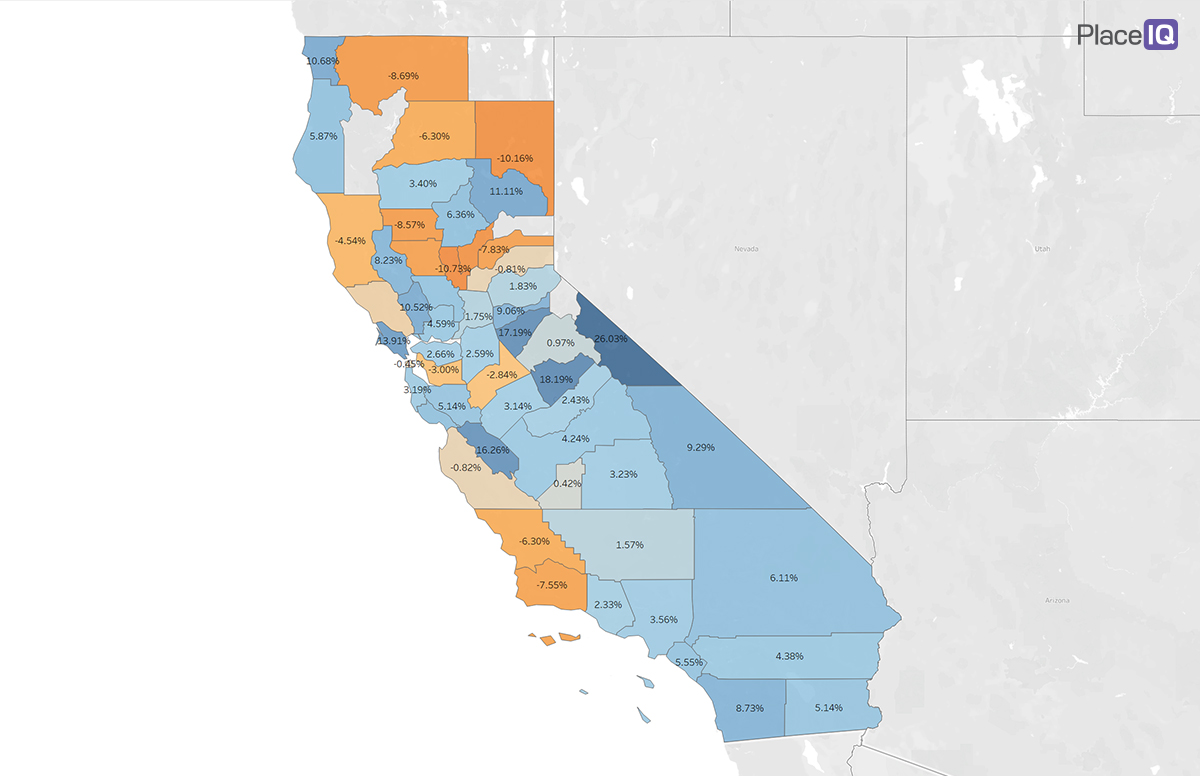

This visualization surprised us. We knew that recovery varied from county to county, but to see that the amount of growth or shrinkage over time varies nearly as much is astounding. Over a four week period, some counties lost 10% of their gains while others grew their reemergence by double digits.
Unfortunately for business strategy and planning, this fact increases complexity by a factor. We’ve been encouraging you to plan at a level of increased geographic granularity. This analysis shows we must also continually monitor the trajectory of these regions week to week. And remember: these plots were made using data before this week’s COVID growth.
We’re going to try to send you into the weekend on a positive note. Here is the same fast food reemergence plot for the Northeast:
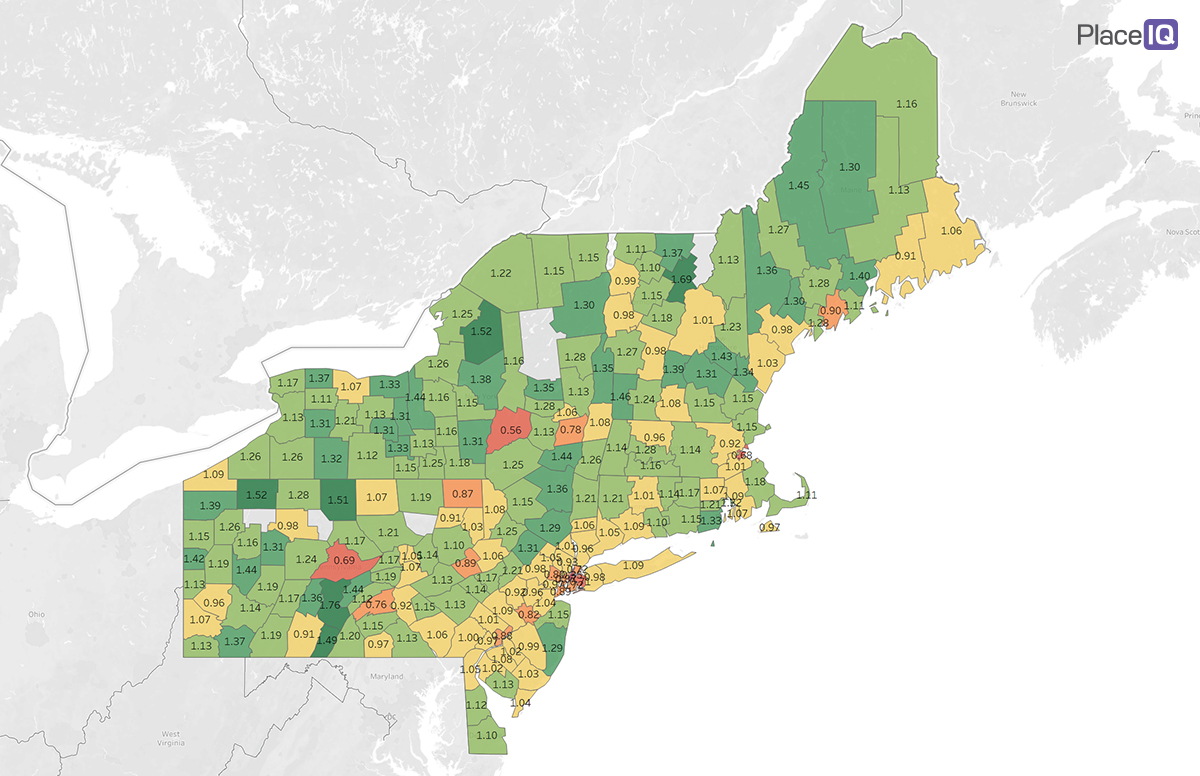
Here, traffic is variable from county to county, but overall fast food traffic is significantly up versus pre-COVID norms. For this category and region, this heatmap is a representation of recovery. It’s been moving this direction for over a month. And yet: with this reemergence, we have not seen it anecdotally correlate to increased infection rates.
There are green shoots — for business and health. We will need to find the success stories, learn from them, and repeat them.
To learn more about the data behind this article and what PlaceIQ has to offer, visit https://www.placeiq.com/.


Sign up to receive our stories in your inbox.
Data is changing the speed of business. Investors, Corporations, and Governments are buying new, differentiated data to gain visibility make better decisions. Don't fall behind. Let us help.


Sign up to receive our stories in your inbox.
Data is changing the speed of business. Investors, Corporations, and Governments are buying new, differentiated data to gain visibility make better decisions. Don't fall behind. Let us help.