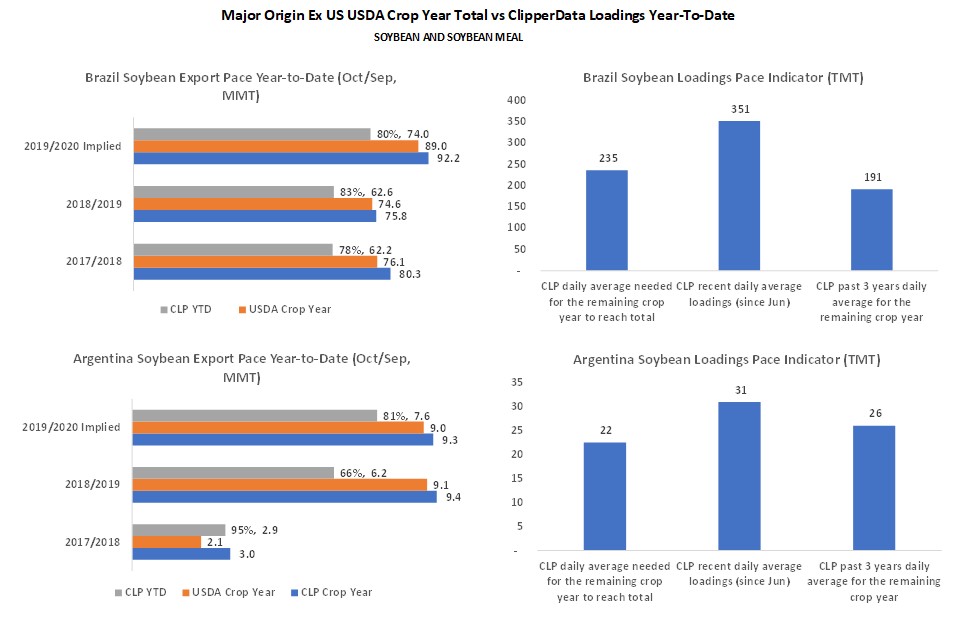
The export tracker provides us a view of where we stand in terms of pace in grains exports. By comparing Clipperdata’s up-to-date tracking of commodity loadings and the USDA estimated crop year exports, it calculates the ratio that has been shipped for the current marketing year, factoring a historical average difference between crop year Clipperdata trackings and USDA officials. It calculates daily/ weekly average exports that need to take pace for the remainder of the crop year in order to reach the USDA estimated crop year exports. It compares this number to recent exports for the current marketing year as well as averages from historical marketing years for the same window to indicate whether the future loadings pace will be stronger or weaker.
We provide the above for corn, wheat, soybean and soybean meal, for major loading countries. With regard to past loadings, we use USDA exports sales reported public information for the US, while for the rest of the world, we use Clipperdata’s proprietary loadings data.
To learn more about the data behind this article and what ClipperData has to offer, visit https://clipperdata.com/.


Sign up to receive our stories in your inbox.
Data is changing the speed of business. Investors, Corporations, and Governments are buying new, differentiated data to gain visibility make better decisions. Don't fall behind. Let us help.


Sign up to receive our stories in your inbox.
Data is changing the speed of business. Investors, Corporations, and Governments are buying new, differentiated data to gain visibility make better decisions. Don't fall behind. Let us help.


