

Kinsa’s data show that illness transmission accelerated in many states over the past few weeks, and this trend is now translating into growing COVID-19 cases in states like Louisiana, South Carolina and Tennessee. But two of the states that are on our watchlist – Pennsylvania and Michigan – have not yet seen significant growth in cases. Our data suggest that may be about to change.
Both Pennsylvania and Michigan currently have <10 new daily cases per 100k population – a significantly better picture than states like Florida and Arizona, which have closer to 50 new daily cases per 100k population. The relatively low case rate in these states follows a period of slow illness transmission in May and early June. Our data show that the rate of illness spread, Rt, largely stayed below one during this time, indicating that spread was well-controlled (Figure 1).
What is Rt?
A disease’s effective reproductive number, Rt, refers to how many people each infected person will spread the disease to. It is a critical metric used to understand whether an illness outbreak is under control, with values above 1 indicating that illness is spreading, and values below 1 indicating that an outbreak will eventually fizzle out. Kinsa uses hyper-local fever data to derive our own real-time measure of Rt for flu-like illness (including COVID-19). Kinsa’s Rt measure is a three-week leading indicator of COVID-19 case growth.
However, that trend has changed in the past three weeks. Pennsylvania began reopening in June, and Kinsa data show that illness transmission started to exceed one by the end of the month (Figure 1). Rt levels above one suggest that each sick person is transmitting the virus to more than one person. When transmission rates exceed one for a sustained period of time, it can lead to an uncontrolled outbreak. In Pennsylvania, Rt has remained above one for the past three weeks.
We saw a similar picture in Michigan, with controlled levels of illness transmission throughout May and early June, followed by acceleration in late June and into July (Figure 1).
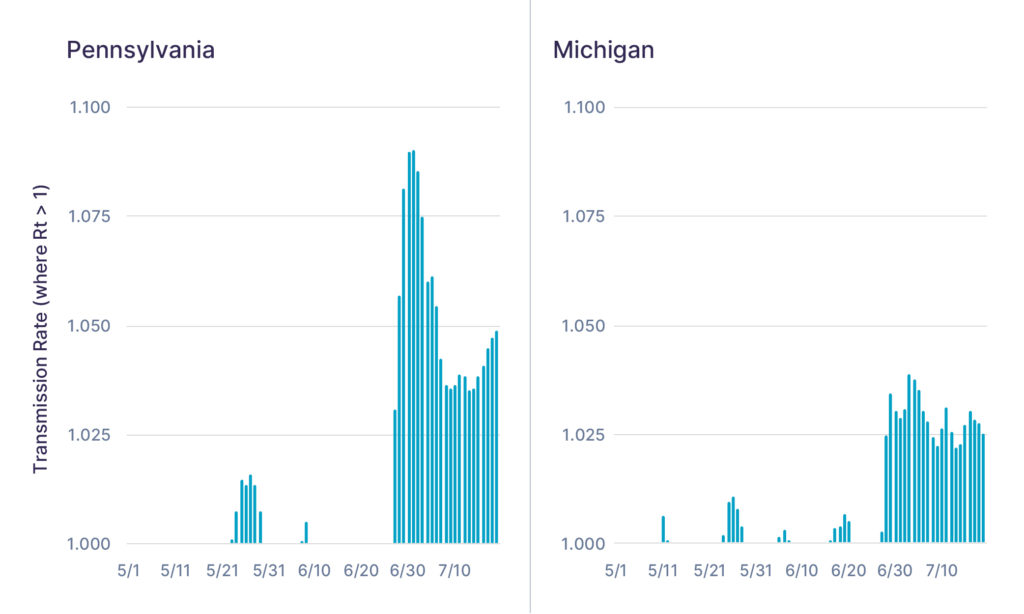
Figure 1: Pennsylvania and Michigan showing elevated Rt from late June through mid July.
Similar patterns have preceded outbreaks in other states, such as Arizona and Georgia (Figure 2), which saw significant growth in COVID-19 cases following elevated transmission levels in late May and early June. A second spike in Rt in both states in recent weeks is cause for concern about what lies ahead.
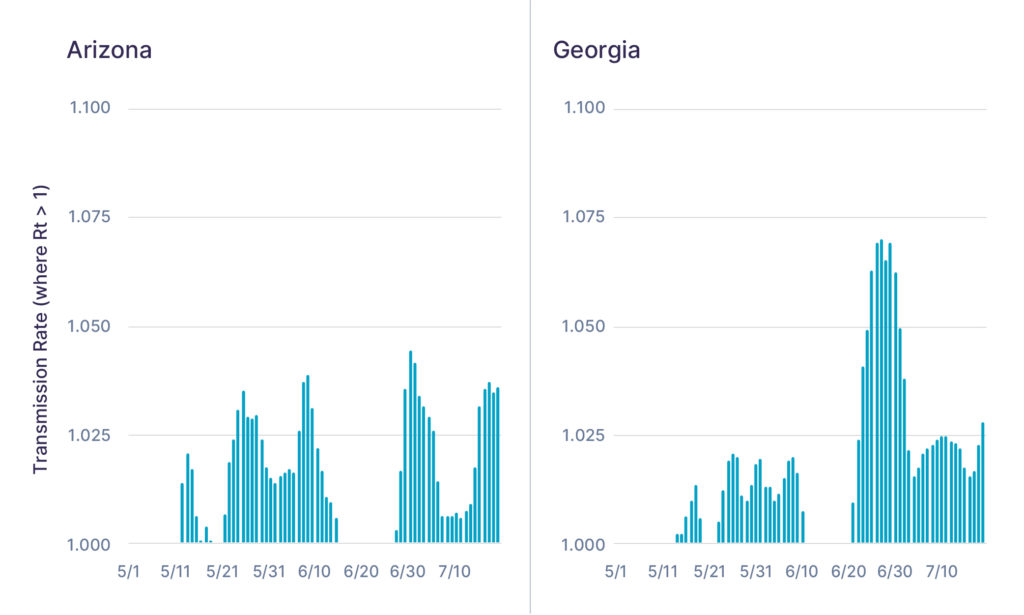
Figure 2: Arizona and Georgia showing elevated Rt in May, which preceded outbreaks in early to mid-June. Rt levels in these states rose again in July.
To help prevent the spread of COVID-19, both Michigan and Pennsylvania implemented mitigation measures in July, with Pennsylvania reducing bar and restaurant maximum capacity and Michigan halting indoor bar service in most of the state. While we are hopeful that these measures will help to slow COVID-19 case growth, the recent sustained high rates of community transmission suggest that we will see a substantial increase in COVID-19 cases in both states in the near-term.
States to Watch
Kinsa data show sustained high rates of illness transmission in recent weeks, suggesting that a near-term increase in COVID-19 cases is likely in the following states:
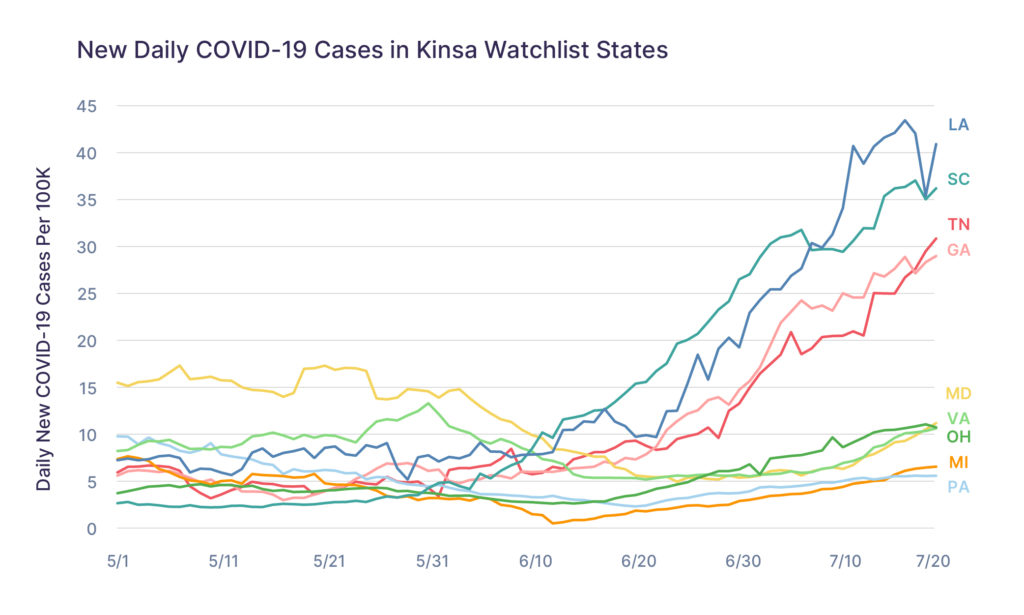
Figure 3: Daily new COVID-19 cases per 100k population (seven day moving average) for each state on the watchlist.
Some of these states, like Louisiana, South Carolina, Tennessee and Georgia, already have ongoing serious outbreaks, whereas others like Pennsylvania and Michigan currently have lower daily new cases (Figure 3). What all of these states have in common is that our data suggest their outbreaks will likely worsen in the near-term.
To learn more about the data behind this article and what Kinsa has to offer, visit https://www.kinsahealth.co/.


Sign up to receive our stories in your inbox.
Data is changing the speed of business. Investors, Corporations, and Governments are buying new, differentiated data to gain visibility make better decisions. Don't fall behind. Let us help.


Sign up to receive our stories in your inbox.
Data is changing the speed of business. Investors, Corporations, and Governments are buying new, differentiated data to gain visibility make better decisions. Don't fall behind. Let us help.