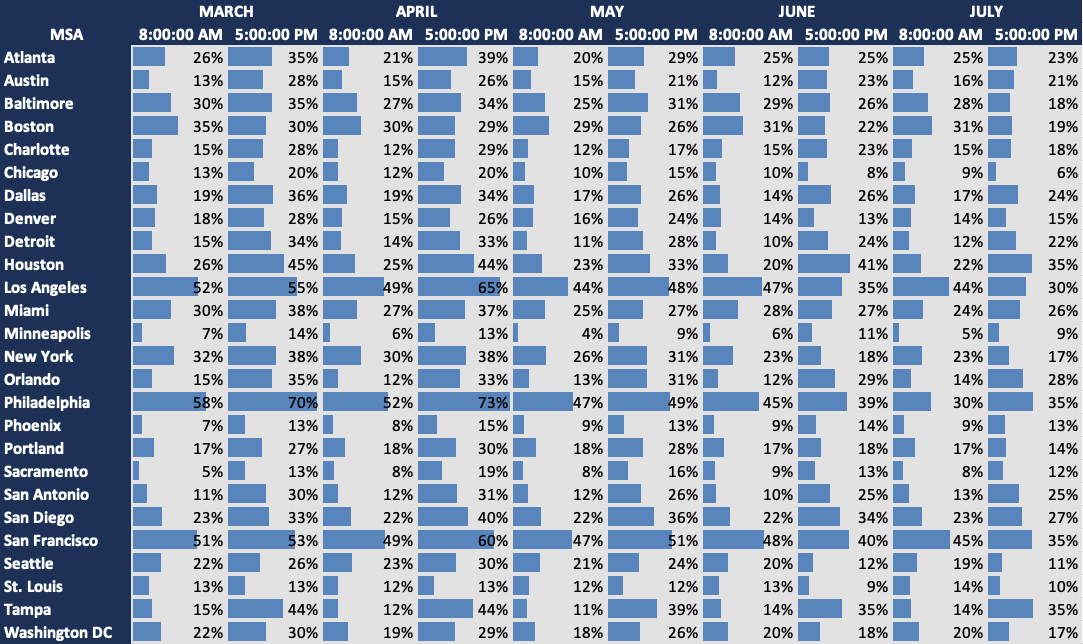
With fewer vehicles on the road, traveling fewer miles, along with a shift in travel by time of day, INRIX compared travel speeds in the last full week of each month to see how travel times have changed. See the table below:

Travel speeds compared to pre-COVID (February) baseline
As we can see, most Metropolitan Statistical Areas (MSAs) have seen travel speeds increase over the past few months, though they are beginning to come down as traffic returns. In the AM commute, San Francisco and Los Angeles continue to see the largest speed gains – which reflect fewer vehicles and VMT during morning rush hour. During the evening rush hour, Houston, Philadelphia and, San Francisco and Tampa show a 35% increase in speeds at 5:00PM.
Compared to April, the lowest month for VMT, July travel speeds have fallen across most MSAs, with the largest drops occurring at the 5PM rush hour in Philadelphia (-22%), Los Angeles (-21%), New York (-16%), San Francisco (-16%) and Seattle (-16%).
As cities and states continue to re-evaluate their plans to attack COVID-19 via restrictions on public gatherings, INRIX will continue to monitor things on the ground to give travelers, fleet operators, public agencies and news media the most up-to-date data on an ever-changing landscape.
To learn more about the data behind this article and what Inrix has to offer, visit https://inrix.com/.


Sign up to receive our stories in your inbox.
Data is changing the speed of business. Investors, Corporations, and Governments are buying new, differentiated data to gain visibility make better decisions. Don't fall behind. Let us help.


Sign up to receive our stories in your inbox.
Data is changing the speed of business. Investors, Corporations, and Governments are buying new, differentiated data to gain visibility make better decisions. Don't fall behind. Let us help.


