The past 30 weeks have seen the number of cancelled flights go through the roof as a result of the global pandemic, causing disruption to passengers, airlines and airports
Last week we looked at how airlines managed schedules during Covid. This week take a look the cancellation disruption and management at country level and how they got it under control.
In usual times airlines avoid flight cancellations in the 72 hours running up to the scheduled departure time for a flight. Typically, flight cancellations are an unavoidable consequence of technical failures, such as problems with an aircraft, or due to weather disruption. The proportion of flights cancelled isone of those key metrics that management and operations staff would be keeping an eye on.
However, as spikes in cases of the virus led to new lockdowns, airlines were forced to cancel hundreds of flights at short notice. Using OAG’s cancellation dashboard we have analysed:
The unprecedented scale of cancellations and the timing of when they had most impact by country
When cancellations became a routine element of each region’s capacity share
How long it took to stabilise so travellers could be confident that the public schedule would be the one that would fly
Early Warnings From China
Weeks 1-10: 1st January to 10 March
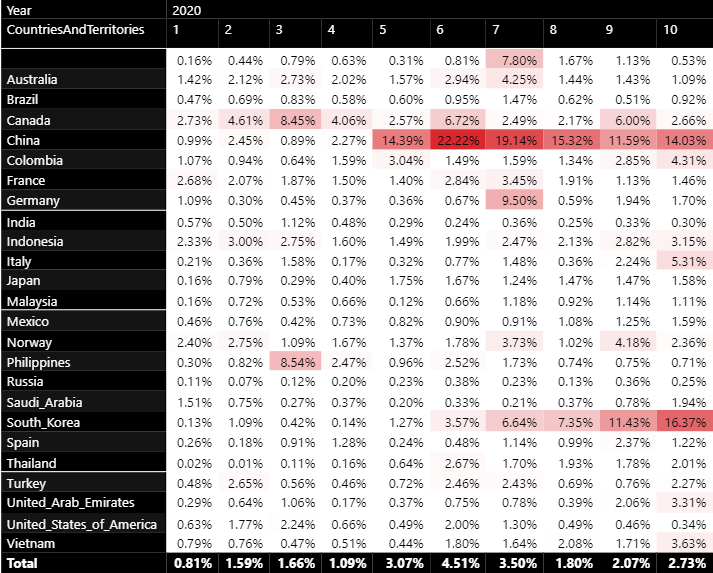
2020 was a fairly typical start to the year for flight cancellations. Across a basket of 24 countries, including many of the largest aviation markets in the world, fewer than 1% of flights were cancelled in the first week. The proportion of flights which were cancelled varied between a high of 2.73% (Canada) and a low of 0.02% (Thailand). The remainder of January was similar although the higher proportion of flights that were cancelled rose to 1.59% in the second week, and 1.66% in the third week before lowering to closer to 1% by the end of the month.

Through January covid-19 had been spreading in China and by 1st February countries around the world were closing their borders to arrivals from China. This is when the number of flight cancellations in China started to rise rapidly. In 2019 only 10% of departing flights from China were to international destinations, but flight cancellations rose as high as 22%, an indication that the impact was being felt far more widely than just on international air services to and from China as restrictions on movement within China took hold and demand for air travel plummeted.
By mid-March, none of the other countries in our basket were showing any flight cancellations effect from covid-19 with the exception of South Korea which had seen the proportion of cancelled flights rise steadily for a month.
April Turbulence
Weeks 11-20: 11 March to 19 May

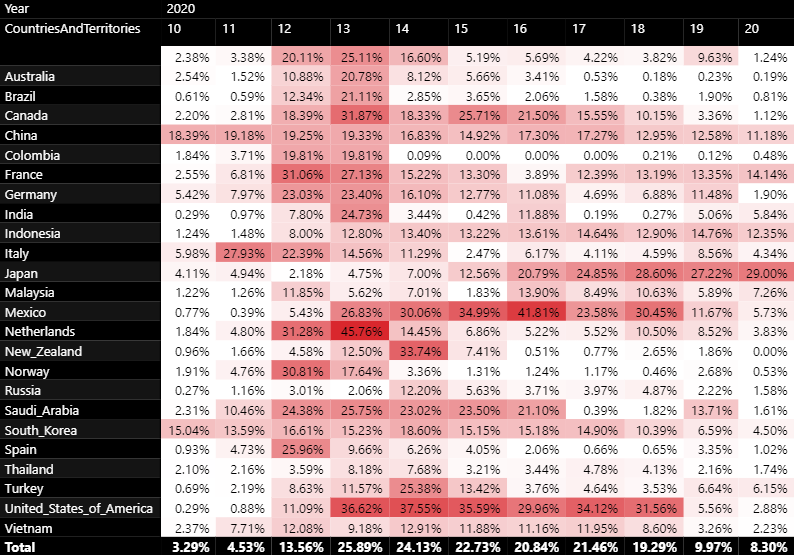
It was the week of 18th March (Week 12) when the impact of covid-19 on commercial flying made it’s weight known. 17 of these 24 countries saw the proportion of cancelled flights rise into double digits as countries rushed to close borders. The following 3-4 weeks were chaotic as travellers tried to return home, airlines operated repatriation flights, but demand fell through the floor and airlines consolidated flights, grounded planes and changed their operating schedule at short notice.
For some countries the chaotic phases was relatively short lived. The Netherlands, had a three-week period when flight cancellations rose to unprecedented levels – 46% for the very end of March - before falling to under 10%. Various other countries followed a smilar pattern – Spain, Australia, Colombia, Norway, dealing with the crisis and quickly adapting their schedule to become more realistic.
Some countries, or airlines, took a different path. In North America the number of cancellations remained high over a period of 7 weeks but by mid May (Week 20) cancellations were under control.
By then, China too appeared to have brought the number of cancellations under control, though they had been running at over 10% for 16 weeks. Japan, which saw cancellations start to rise a full 11 weeks later than China, followed a similar path to China with flight cancellations running at over 10% of scheduled flights for 16 weeks until the end of July.
China and Japan, widely known for the high density of flights on key city pair corridors
chose to continue with their pre-existing schedule, knowing they could cancel flights and reallocate passengers to another flight on the same route without too much impact on passenger travel plans.
Airlines Schedules Realistic
Weeks 21-30: 20 May to 28 July
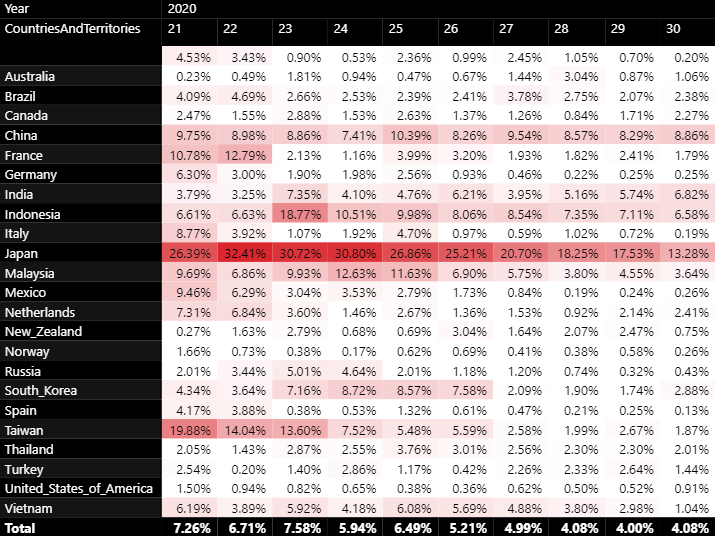
As we moved into June and July it is clear than airlines had got their schedules under control, albeit with massively reduced numbers of flights. As a consequence, the number of flight cancellations has returned to a more normal level except where there are localised spikes in coronavirus, as was seen in China in Beijing in mid June, where the effect of new travel restrictions led to a short-lived increase in cancelled flights.

Looking ahead
Until March airlines had never been in a position before where they had to consider cancelling large parts of their schedule for weeks and even months ahead, in tandem with all other airlines. The scale of making so many schedule adjustments in such a short space of time, with the uncertainty of not knowing when they’d be able to resume flying, was a massive logistical challenge.
Further cancellations are inevitable whenever spikes in covid-19 cases occur. As an example, on July 27th an infection spike in Northern Spain prompted the UK government to require holidaymakers to self-isolate for two weeks on returning from Spain, a move which affected travellers already in Spain and those about to travel. TUI, a leading airline and travel company, promptly cancelled all flights to the Spanish Mainland for a two-week period.
Rather than widespread cancellations, this pattern of handling cancellations is short-lived and regionally specific actions will be more likely in future, especially given how much more data is available now about the prevalence of covid-19. Airlines are no longer being taken by surprise and have time to plan on how to handle such events.
To learn more about the data behind this article and what OAG has to offer, visit https://www.oag.com/.


Sign up to receive our stories in your inbox.
Data is changing the speed of business. Investors, Corporations, and Governments are buying new, differentiated data to gain visibility make better decisions. Don't fall behind. Let us help.


Sign up to receive our stories in your inbox.
Data is changing the speed of business. Investors, Corporations, and Governments are buying new, differentiated data to gain visibility make better decisions. Don't fall behind. Let us help.


