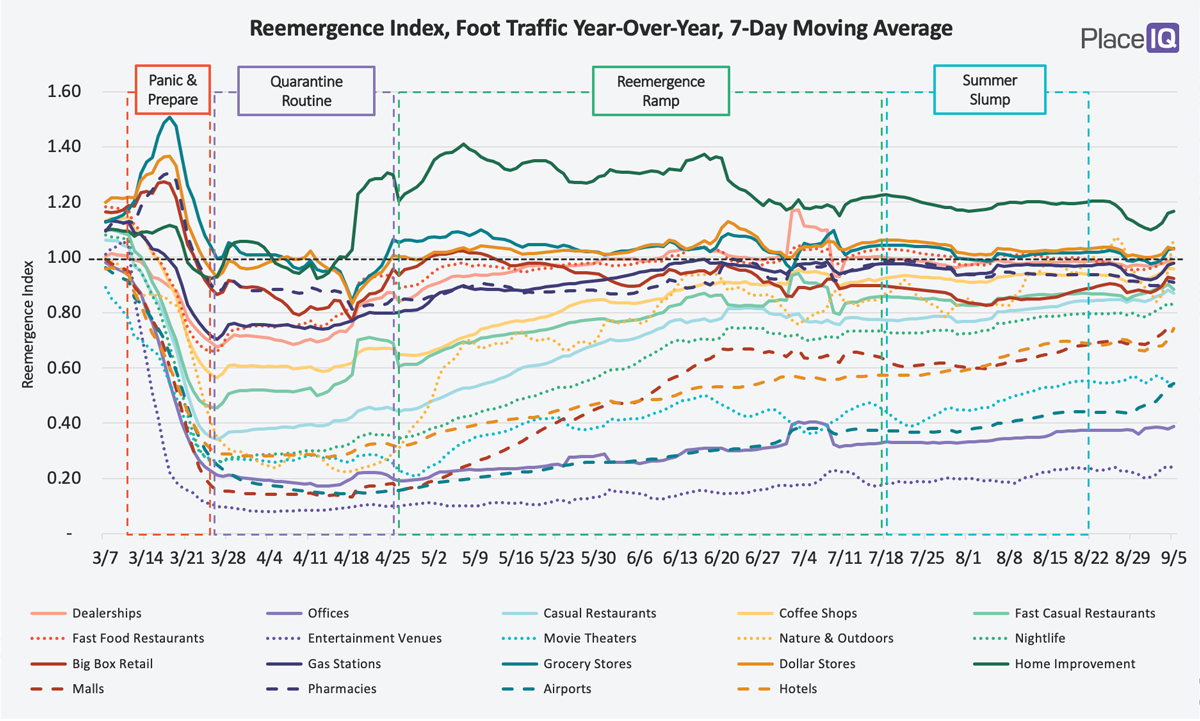
Coronavirus metrics across most of the US continue to head in the right direction. We’re starting to see some upticks in traffic; most categories are slightly up. Though, not quite dramatically enough to coin a new phrase to follow the Summer Slump. Let’s see what happens next week.
Interestingly, we’re seeing a jump in the tourism segment. Visits to airports, hotels, and outdoor areas are up significantly vs. a year prior. We’ll be diving into this in the future to better understand who is traveling, but it’s notable this is occurring just as school restarts. Could distance learning extend the travel season? Are families taking a week or two away while dialing in remotely? Is it simply a Labor Day spike? Such behaviors would drive this year-over-year bump, but we’ll have to dig in more once more data accrues.
Today, we’ll be taking a look at visit durations to various venues. Previously we’ve compared visit durations by looking at the average. If we analyze different buckets of duration, we can see which businesses have changed… and which have stayed the same.
Visit Durations Highlight Business Transformations
When we’ve looked at visit duration figures in the past, we’ve used average duration to compare venues, categories, and time periods. We’ve seen that visits to grocery stores became longer and visits to restaurants became shorter during the Quarantine Routine.
But if we dig a bit deeper, break apart that average duration into buckets of duration we can see a much more detailed picture emerge. Let’s start by looking at Trader Joe’s:
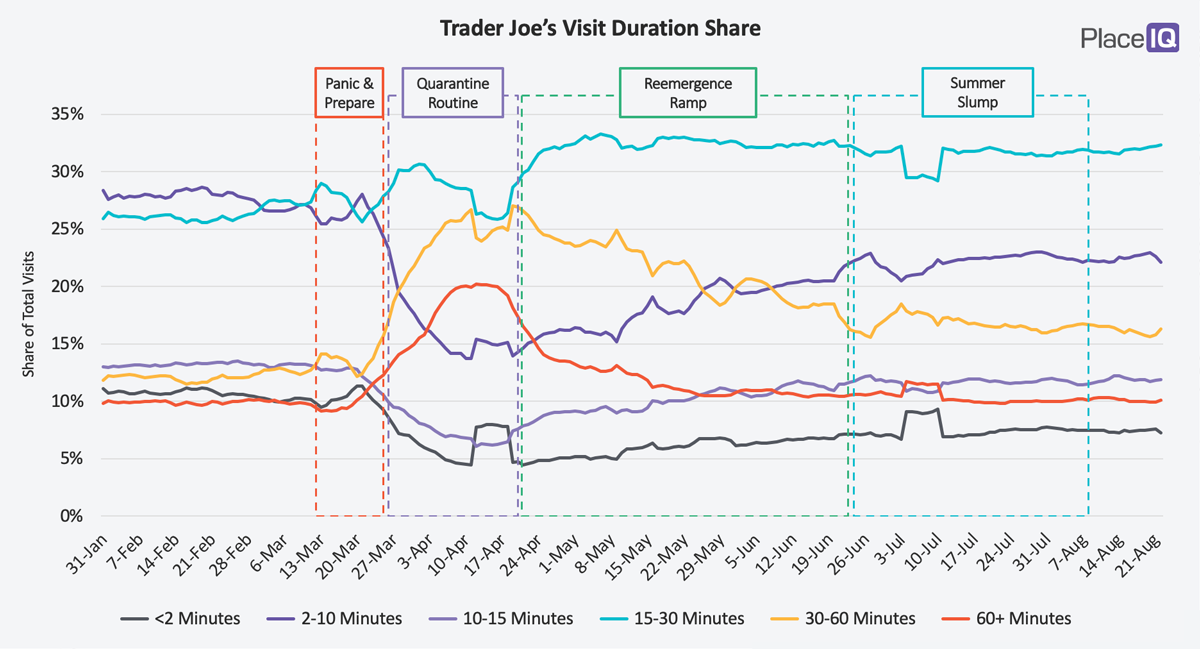
Each line represents a bucket of visits to Trader Joe’s grouped by duration. Add up all the lines for a given day and you’ll get 100%. Given this, we can say: Pre-COVID, more than half of all visits to Trader Joe’s were 30 minutes or less.
All that changed once the Quarantine Routine arrived. Short visits plummeted sharply (2-10 minute visits declined by more than 10 points) and longer visits grew in share. Note the dramatic rise of 30-60 minute visits and 60+ minute visits (the yellow and orange lines, respectively).
This matches what we’d expect for Trader Joe’s. With smaller stores, Trader Joe’s had to aggressively meter how many people went inside at a time, which led to long lines out front. Most of the time it was impossible to make a 2 minute trip. Couple this with people buying more, both to reduce their number of shopping trips and to make up for restaurant meals not eaten, and it’s not surprising that visit durations rose dramatically.
What we’re watching for is how things started to regress after the initial shock of Quarantine. Visit counts to Trader Joe’s (and grocery stores at large) remained relatively constant, but the types of trips being taken changed dramatically over the Reemergence Ramp and the Summer Slump. Very long trips (60+ minutes) regressed back to normal by the Summer Slump and quick mission trips have grown slowly. They remain 5 points below their pre-COVID norms.
As we look at the next few charts, keep these questions in mind: how did visit assortment change during Quarantine, how has it regressed, and what is the new normal?
Trader Joe’s, for example, has a new normal with significantly less quick trips. Compare this to a more typical supermarket, like Safeway. It’s new normal looks nearly identical to its pre-COVID normal:
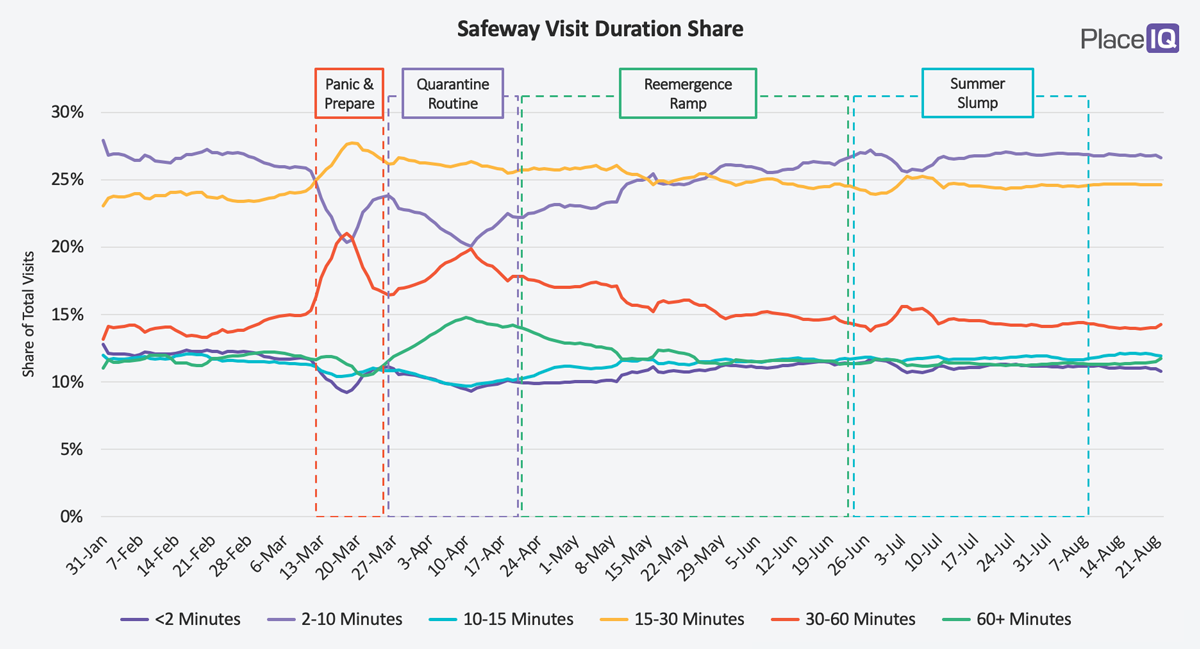
Safeway had 2 months of turmoil before trips regressed to their usual routine. All while their total visit counts remained basically flat.
If we look at dining, our previous insights about the casual, fast casual, and dining categories hold up.
Casual dining continues to be reliant on dine-in traffic. When dining rooms were closed, short visits rose dramatically. When they reopened, longer visits returned. It was like an on/off switch with barely any shades of gray. Take a look at IHOP:
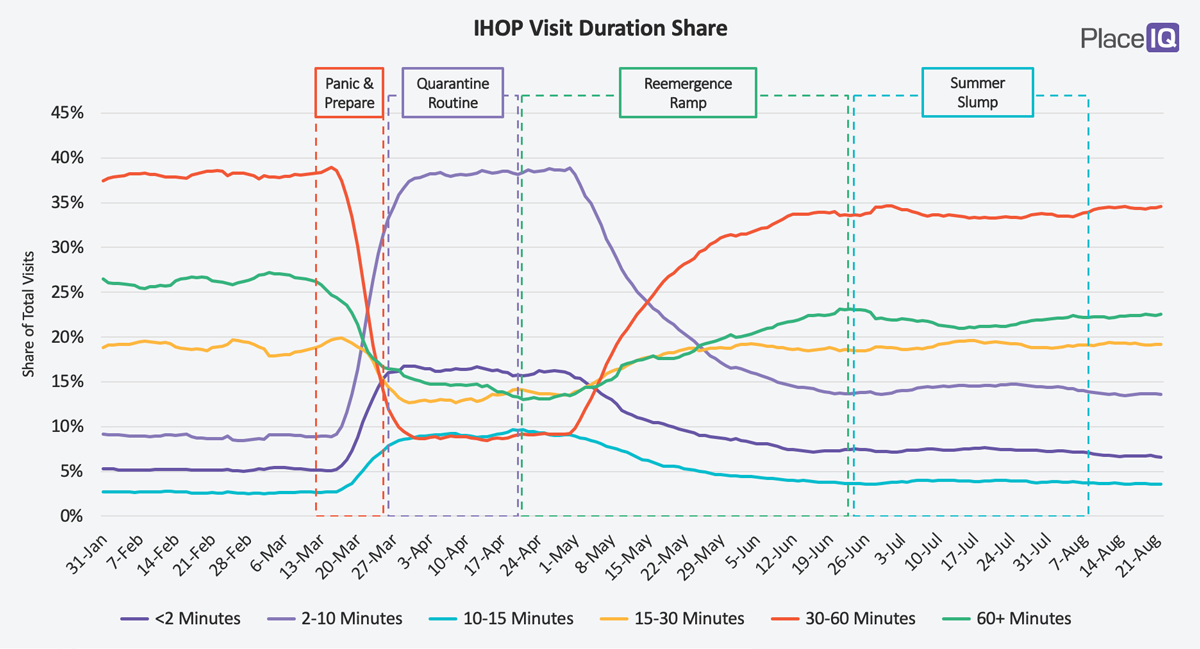
Visits longer than 30 minutes haven’t yet returned to normal levels, but the picture mirrors pre-COVID closely.
Compare this to fast casual, which has completely reconfigured it’s business. Here’s Five Guys:
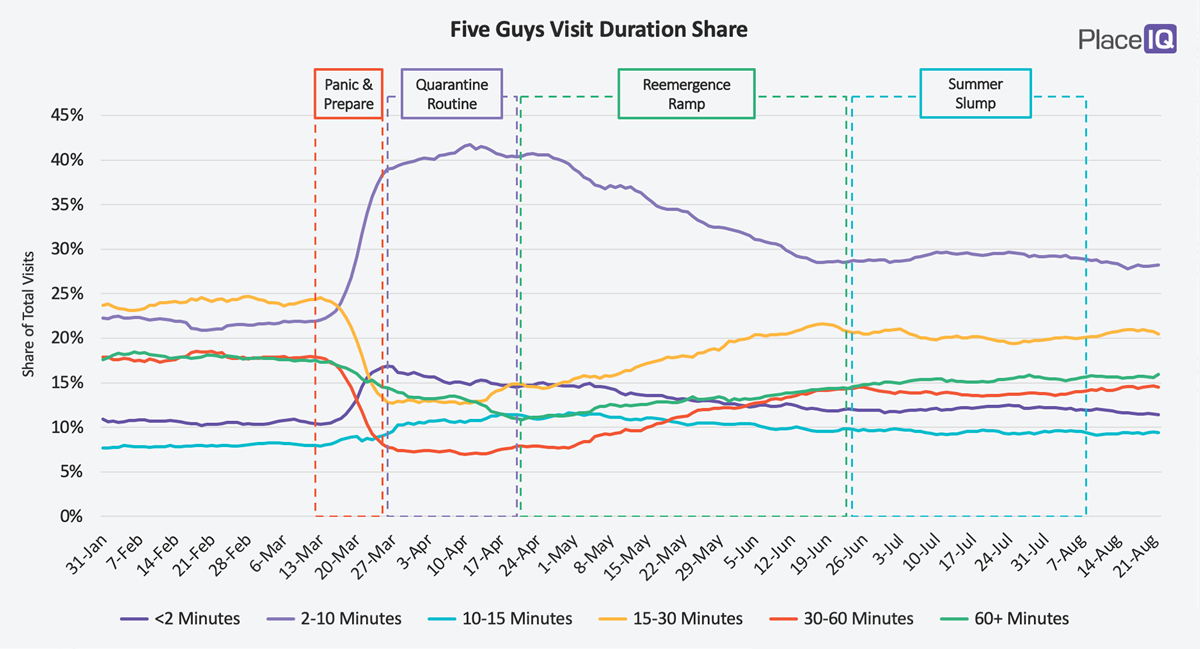
Visits less than 10 minutes have regressed somewhat, but they still dominate the share in a manner completely unlike its pre-COVID makeup. It’s hard not to see this entire category as a wholly different business than it was 6 months ago.
And of course, fast food hasn’t changed:
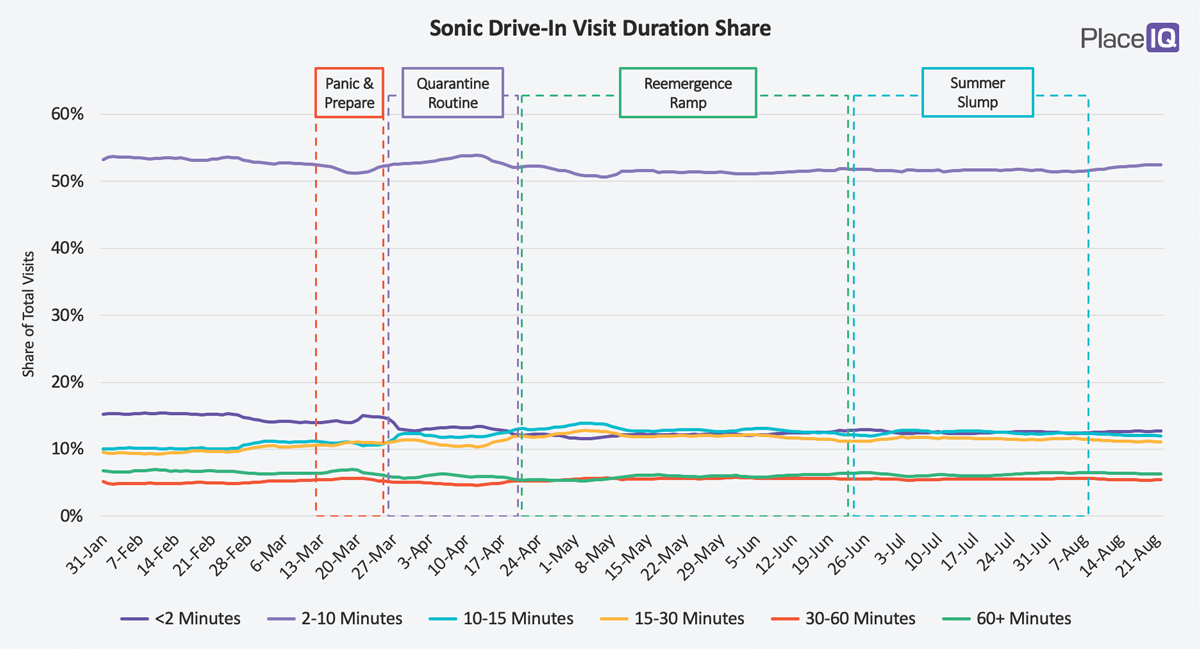
Yes, it may seem obvious to use Sonic Drive-In, but the pattern looks similar for McDonald’s. There’s barely any shock during the first stages of the pandemic. Nothing to regress back to normal from. From this metric’s point of view, nothing notable happened over the last few months!
Looking at duration buckets reveals major shifts in visit types, which we can use to contextualize the visit volumes we measure. As we’ve written many times here: visits aren’t just down, they’re different. How different they are depends on the unique aspects of a given category or venue.
For example, it’s notable that fast food restaurants and large grocery stores have essentially returned to their normal make up (if they changed at all). Both of these venue types can easily comply with social distancing measures due to their size (Safeway’s spaciousness) or their infrastructure (Sonic’s drive-through). Trader Joe’s is the grocery exception that proves the rule: with less square footage and tighter aisles, they’re unable to return to their normal visit makeup while adhering to safety best practices. The same goes for Five Guys – a restaurant with similar fare to Sonic (burgers) but dissimilar infrastructure (no drive-throughs to speak of).
In our recent explorations of the dining category and customer base, using both foot traffic and surveys, it was interesting to see just how important safety measures are to consumers. We expected them to be important, but our analysis revealed how safety measures are essentially table stakes. Those that complain about or disregard safety measures may make the news and the memes, but overall, nearly all of the market values them.
With the visit duration bucket analysis above, safety’s importance is underscored. Visit volumes and makeup are influenced by a venue’s ability to accommodate safety measures with infrastructure or design.
To learn more about the data behind this article and what PlaceIQ has to offer, visit https://www.placeiq.com/.


Sign up to receive our stories in your inbox.
Data is changing the speed of business. Investors, Corporations, and Governments are buying new, differentiated data to gain visibility make better decisions. Don't fall behind. Let us help.


Sign up to receive our stories in your inbox.
Data is changing the speed of business. Investors, Corporations, and Governments are buying new, differentiated data to gain visibility make better decisions. Don't fall behind. Let us help.


