
Prime Day also took 91% of market share among competing sales by Walmart, Target, and Best Buy
Key Takeaways:
Amazon Prime Day — one of the biggest online shopping events of the year — has come and gone, moving to October this year from July. This event, originally 24 hours long, has now expanded to a 48 hour savings extravaganza. As last year’s Edison Trends report about Prime Day 2019 sales had shown, the event has consistently led to record-breaking sales, and this year was no different.
In such a turbulent year for everyone due to COVID-19, all eyes were on Amazon Prime Day and the competing sales as an indicator for the ecommerce industry at large. To find out how the events performed, Edison Trends analyzed over 370,000 US transactions before, during, and after Prime Day 2020.
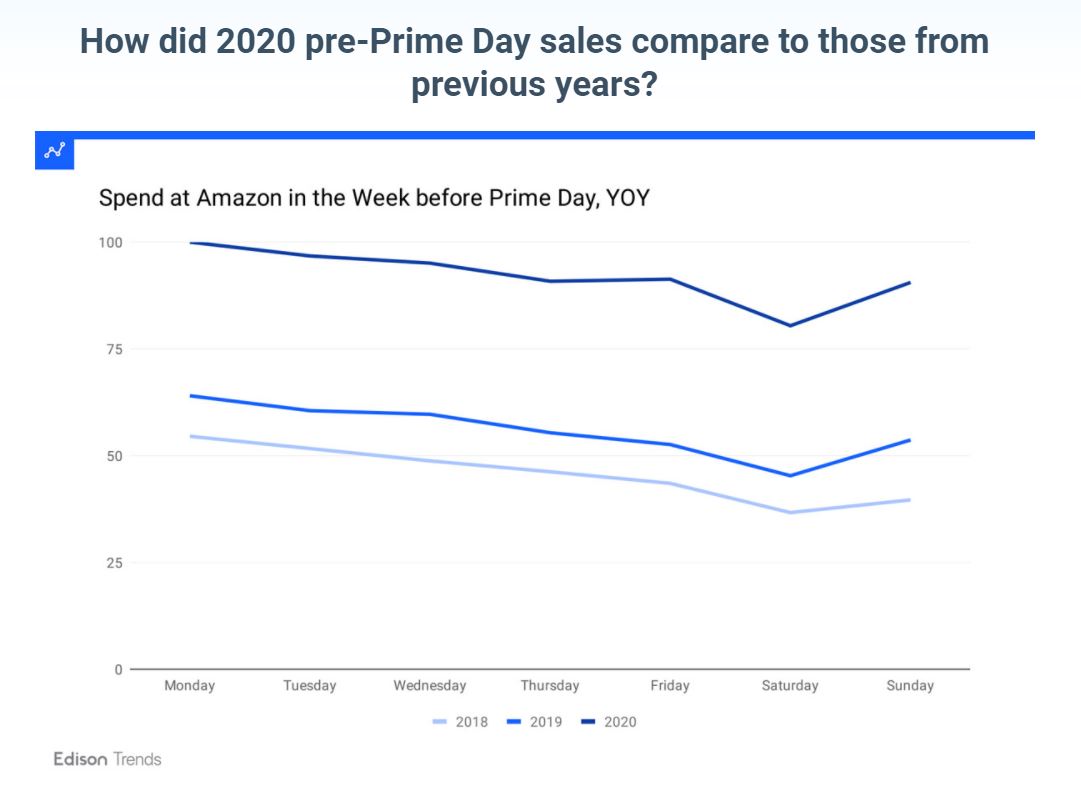
With mounting competition from competitors, Amazon Prime Day started a limited number of sales early this year. Pre-Prime Day spending has increased each year. Looking at the total amount customers spent at Amazon in the Monday through Sunday before the event, 2019 saw a 22% jump over 2018, while 2020 was a whopping 65% over 2019. All three years, however, followed Amazon’s typical pattern, with spending at a high point on Monday and a low on Saturday.
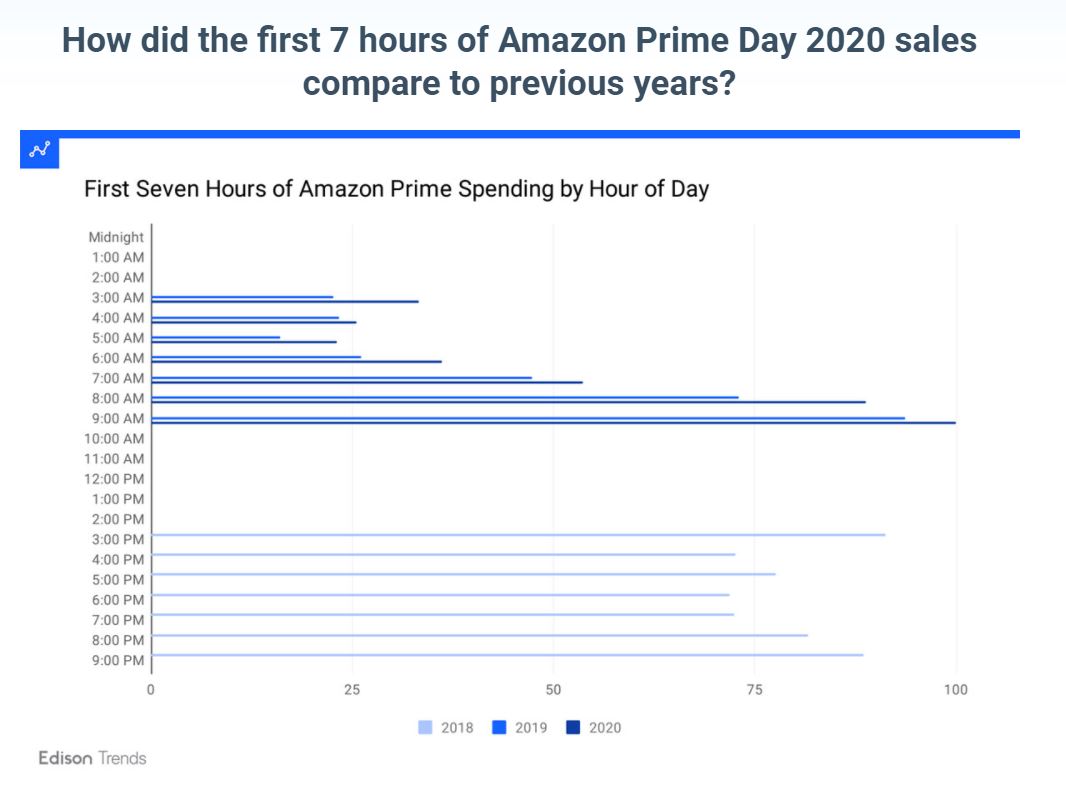
In each of the past two years, Amazon has started its Prime Day sale at 3am ET. In 2018, they had started at 3pm ET. 2018’s customer spending in the first seven hours in the sale was higher overall than in the following two years, but 2020 still beat 2019. During the 3am ET hour, at kickoff, customers spent 46% more than they had in the kickoff hour in 2019. In each hour, customers continued to spend more than they had a year ago, but out of these seven hours, the 3am slot has shown the largest YOY increase. (The average YOY increase among the hour slots was 26%.) In both 2019 and 2020, spending dropped going into the 5am hour and then grew as the morning progressed.
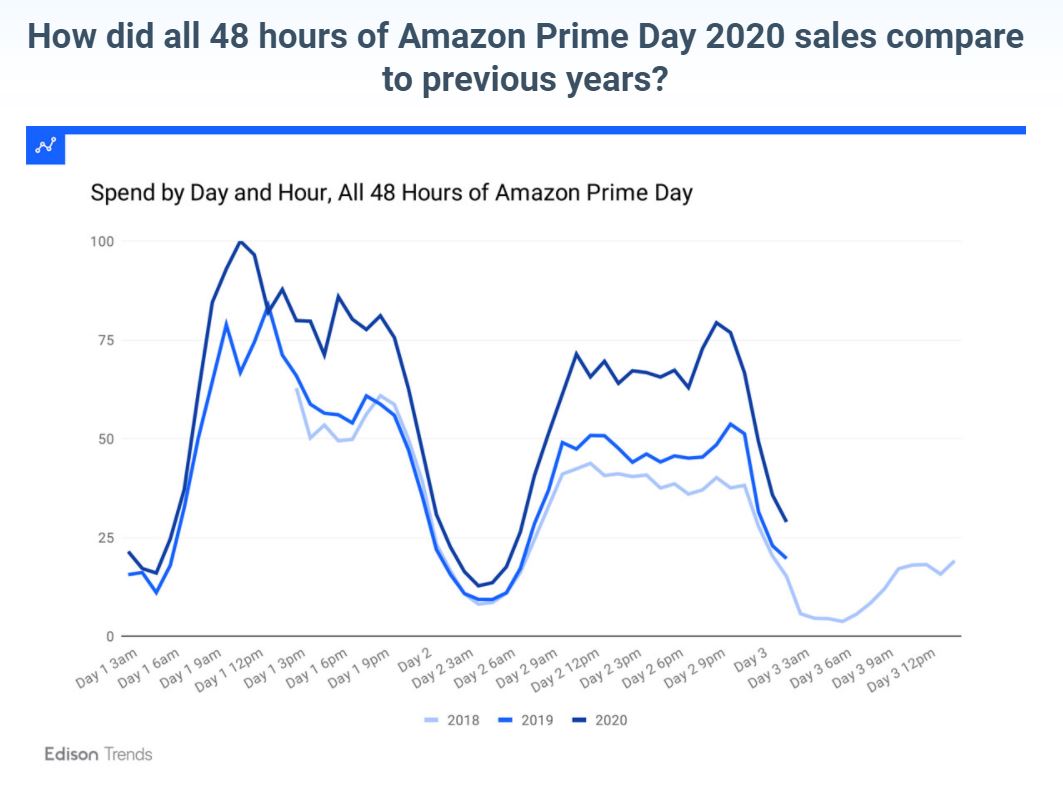
The chart shows customer spending for all 48 hours of Prime Day over the last 3 years. 2020 has beaten 2019 in every hour except Day 1 at 1pm. The hour of 9pm on Day 2 surpassed its 2019 counterpart the most, with spend increasing 64% since last year. The top hour for spend for Prime Day 2020 was Day 1 at 11am ET. For 2019, it was Day 1 at 1pm ET.
The average increase over 2019 across all 48 hours was 38%. Looking at just the first 24 hours, the average hourly increase was 31%; for the next 24, the figure was 46%.
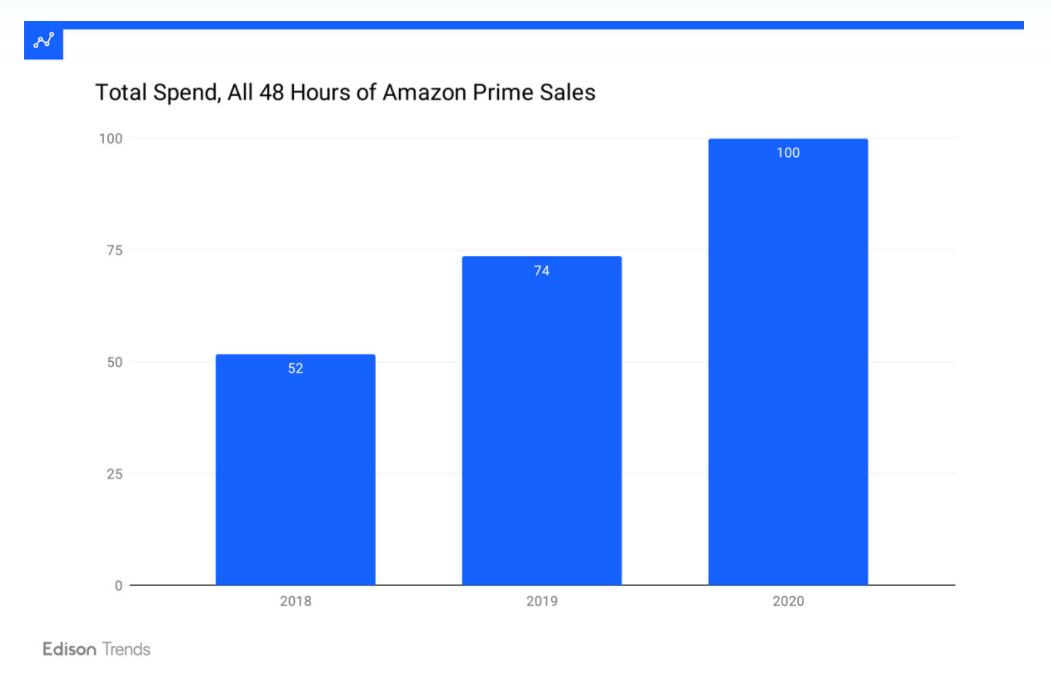
Prime Day has grown each year. In 2020, customers spent 93% more across all 48 hours than 2018, and 36% more in 2020 than 2019. Put another way, 2019 spend was only about 75% of what it has been in 2020.
Looking at the first 24 hours by themselves, total spend was up 30% over the first 24 hours of 2019. For the second 24 hours, that figure was 44%.
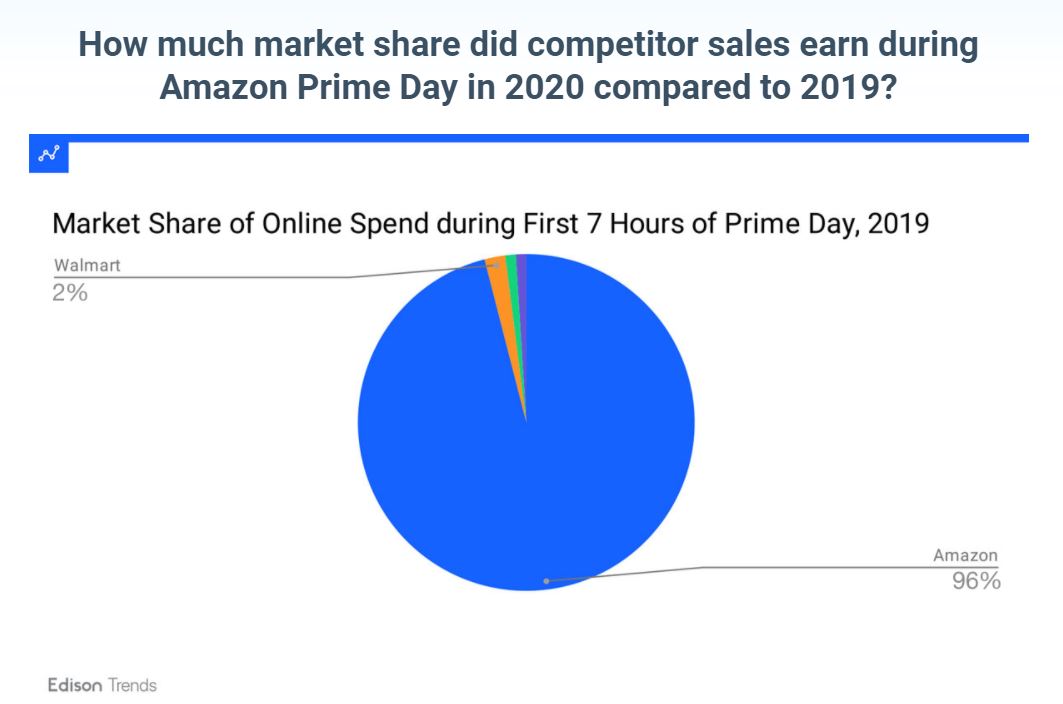
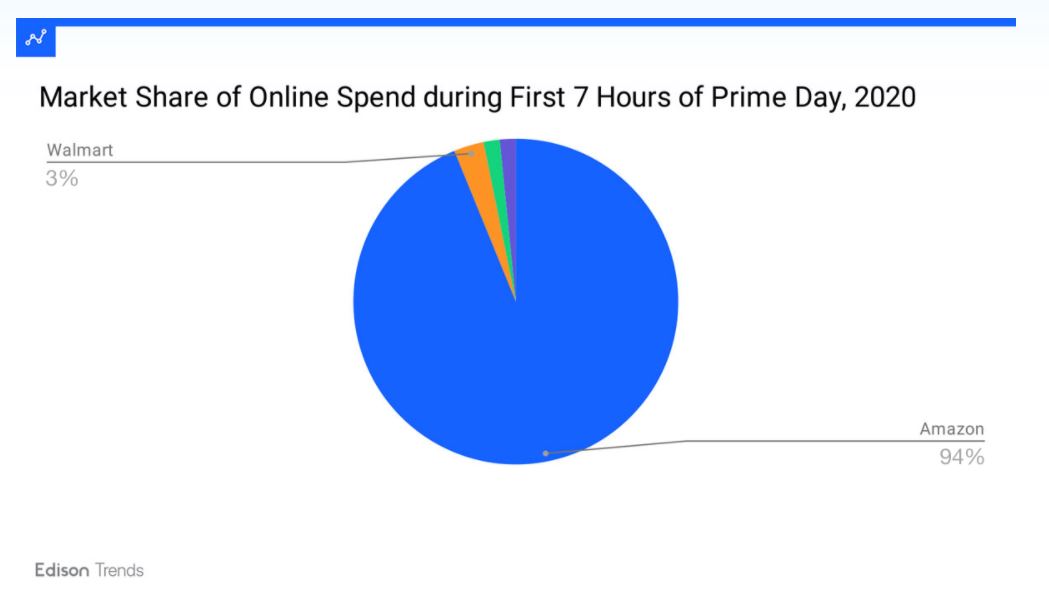
Walmart’s Big Save event ran October 11 - 15, while Target’s Deal Days ran on the 13th and 14th. In 2019, Amazon took 93% of the spending pie between these four merchants over all 48 hours of Prime Day. This year, the figure was similar, at 91%. Likewise, figures for Walmart, Best Buy, and Target remain within 1% of where they stood in 2019, with Walmart and Best Buy in second and third and Target in fourth.
As the market evolves, we will continue to stay on top of the latest trends. To learn more about how Edison Trends can help your business, contact us at bizdev@edison.tech. For more up-to-date insights in the e-commerce space, be sure to subscribe to our newsletter, and follow us on Twitter at @EdisonTrends.
*The data shown is based on a sample of anonymized and aggregated e-receipts from millions of consumers in the United States.
To learn more about the data behind this article and what Edison Trends has to offer, visit https://trends.edison.tech/.


Sign up to receive our stories in your inbox.
Data is changing the speed of business. Investors, Corporations, and Governments are buying new, differentiated data to gain visibility make better decisions. Don't fall behind. Let us help.


Sign up to receive our stories in your inbox.
Data is changing the speed of business. Investors, Corporations, and Governments are buying new, differentiated data to gain visibility make better decisions. Don't fall behind. Let us help.