This week the world welcomes a new US Administration, so it seemed appropriate to have a bit of a deeper dive around the most recent capacity changes across the US States and see if we could spot anything interesting.
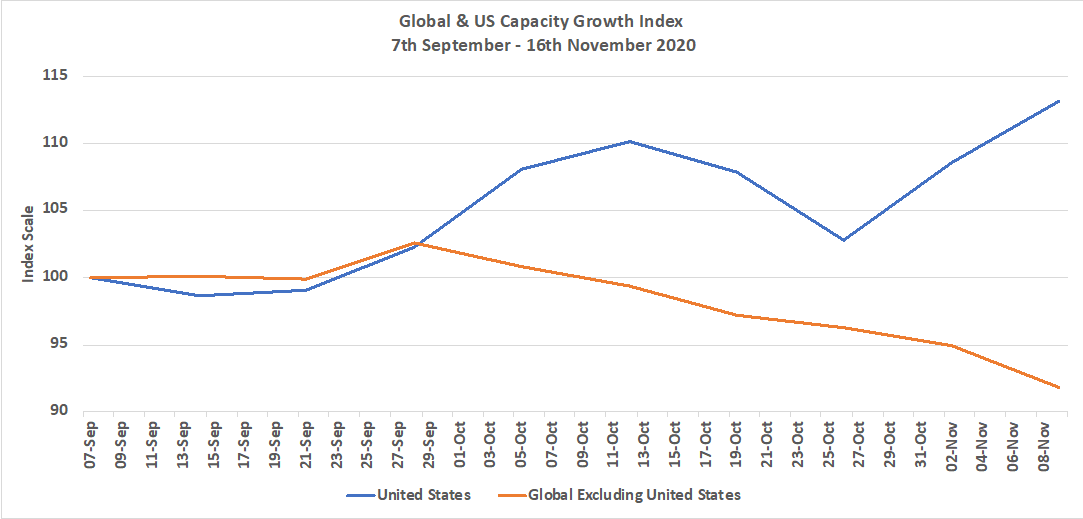
But before diving into the detail the headline numbers are interesting. Since the week commencing the 5th October the US market has reflected a very different trend pattern to the rest of the world as the chart below highlights. Whilst the rest of the world has seen a steady decline in capacity and is now 9 points lower than at the beginning of September, the United States has seen a thirteen-point improvement; a twenty-two-point swing to use pollster terminology.
Chart 1 – Global and US Capacity Growth Since 7th September 2020

International Capacity Races Ahead of Domestic Growth
Clearly many countries around the world have in recent weeks increased quarantine restrictions and applied complete lockdowns in some cases; steps that have yet to be followed by the United States and whilst that is reflected in the data surprisingly international capacity has also been booming. Although domestic capacity has increased by over one million seats, an 11% growth in ten weeks; international capacity has increased by over 40% in the same period.
Two factors appear to be driving the growth in international capacity; an increasing demand for leisure and VFR travel and the easing of travel restrictions to Latin America. In the case of leisure demand Mexico has seen a staggering 70% increase in capacity with Puerto Vallarta seeing capacity triple and both Cancun and San Jose Cabo doubling their weekly capacity. From a market access perspective, the reopening of capacity to countries such as El Salvador, Guatemala and Peru have also welled capacity alongside the return of non-stop services to South Africa.
The growth in the international market is encouraging although of course can change at a moment’s notice but the resilience in the domestic market is perhaps surprising, so what is happening?
The State of the States
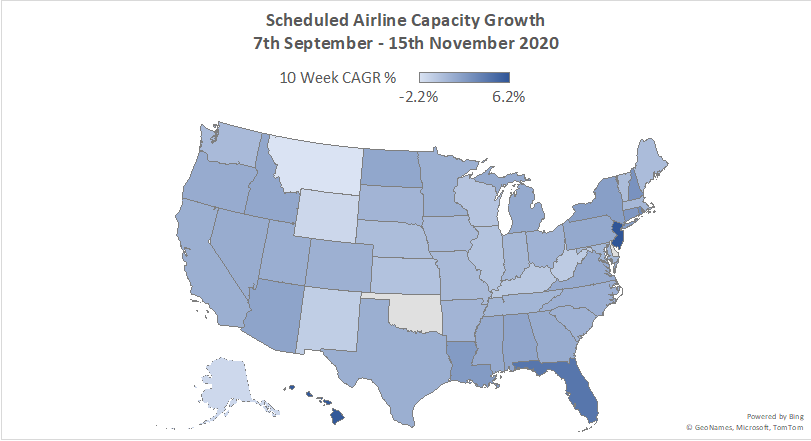
The two themes of increased leisure and perhaps VFR demand and the reopening of some international markets appear to be driving the growth across the US States as the heat map below illustrates.
The three fastest growing States are New Jersey, Hawaii and Florida. In the case of Florida, a “double whammy” effect from both leisure demand and the gateway location for much of the capacity that flows into Latin America explains their position. New Jersey will similarly have benefited from those factors but in capacity terms is a much smaller market, at least from an airport perspective than Florida with its current 1.3 million seats a week.
Map 1 - Capacity Growth by US State

Sadly, as with any data there are losers as well as winners and in this case Montana is the poorest performing State with a loss of over 10,000 scheduled seats a week or nearly 20% of capacity since the 7th September; perhaps a reflection of how the CARES act had supported services to such regional markets. Since the 7th September four routes have been dropped in the State; three of which are from Jackson and were only once weekly so hardly damaging to connectivity from the State to the rest of the world.
Different Winners & Losers Across the Major Airlines
In any capacity recovery you would expect the major airlines to rebuild out from their hubs and that is normally the case; but Covid-19 has been anything other than a normal event for the industry. In some cases, major carriers have focussed on point to point leisure markets and in some cases the opening of access to a new market such as Hawaii can have an influence on where the rebuild takes place.
For the four largest carriers we have looked at both their top five growth markets and also the five in which they have shaved capacity and it is slightly different for each carrier. Hawaii naturally was the fastest growth market for all of the majors; it had to be!
Florida appeared in the top five for three of the four airlines but perhaps surprisingly not for Southwest although with some 230,000 seats a week they are only second to Delta Air Lines in that particular market. Arizona and Nevada appear twice in the top five listings, for both United and Delta suggesting perhaps they are both seeking to attract the same traffic flows on their network. And Pennsylvania makes just one appearance; a low-key state compared to the recent weeks press activity at least.
Table 1 - Top 5 Growth States by Airline, 7th September – 15th November 2020

The list of States reporting the greatest cuts in capacity reflects a wider range of markets; only Montana and Wyoming appearing in twice across the four largest airlines. Perhaps surprisingly, Illinois appears in American Airlines bottom five given their Chicago O’Hare hub, the airline has cut some 30,000 seats a week since the 7th September with some 14 routes being dropped from O’Hare with a loss of 11,500 departing seats a week.
Table 2 – Top 5 Declining States by Airline, 7th September – 15th November 2020

Reasons for Hope
Despite the current absence of any airline support packages in the United States capacity has in an almost counter intuitive way grown significantly with some airline executives openly discussing a pick-up in demand over recent weeks. Throughout the Covid-19 pandemic we have regularly noted that domestic travel for leisure and VFR purposes will be quicker to recover than other sectors and with no regional or State lockdowns (yet) impacting travel the signs are indeed, from a capacity perspective, encouraging.
Equally, early data suggests that current yields are anything up to 20% below last year as airlines stimulate demand; short-term that’s fine but for the airlines a recovery of yields will be crucial.
As always there are winners and losers in our State by State analysis; that will always be the case; not everyone can win every time but most importantly if the upside is bigger than the downside, for the US aviation industry that has to be good news and perhaps an early sign of increased positivity for the US and wider industry.
To learn more about the data behind this article and what OAG has to offer, visit https://www.oag.com/.


Sign up to receive our stories in your inbox.
Data is changing the speed of business. Investors, Corporations, and Governments are buying new, differentiated data to gain visibility make better decisions. Don't fall behind. Let us help.


Sign up to receive our stories in your inbox.
Data is changing the speed of business. Investors, Corporations, and Governments are buying new, differentiated data to gain visibility make better decisions. Don't fall behind. Let us help.


