
Introduction
Welcome to the December 2020 National Apartment List Rent Report. With the peak summer renting season behind us, we are now entering the time of year when fewer moves normally take place, causing a seasonal dip in rent prices. And although this year’s peak season was significantly disrupted due to the COVID-19 pandemic, our national index has stabilized back to a more typical trend over the past few months. Rents fell by 0.5 percent this month, which is consistent with what we’ve seen in the past.
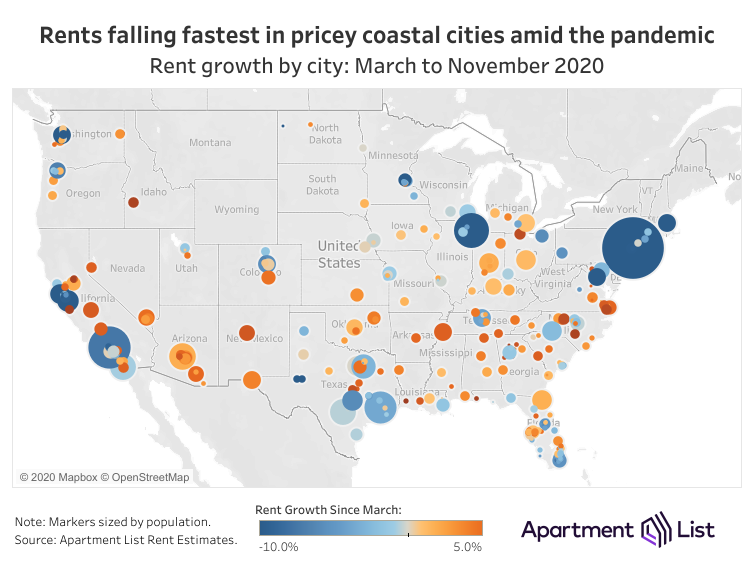
That said, when we look past the national figures, we find tremendous regional variation in rent trends. Expensive coastal cities such as San Francisco, Seattle, and New York City are continuing to see rents fall rapidly, while traditionally affordable suburban cities such as Boise have actually become more expensive over the course of the year. The interactive chart below allows you to explore the city-level data and highlights the stark differences between rental markets across the country.
Below we dive deeper into this notion that national rent trends look similar to previous years while a number of new and unique local trends are emerging just under the surface.
November Rent Decline Is In Line with Typical Seasonality, but Masks Regional Variation
In November, our national rent index fell by 0.5 percent month-over-month. Unlike the atypical rent decline we witnessed during the summer, today continued rent reductions are in line with normal seasonality in the market. In fact, rent has declined 0.5 percent from October to November in each of the last three years. Year over year, national rents are now down 1.3 percent.
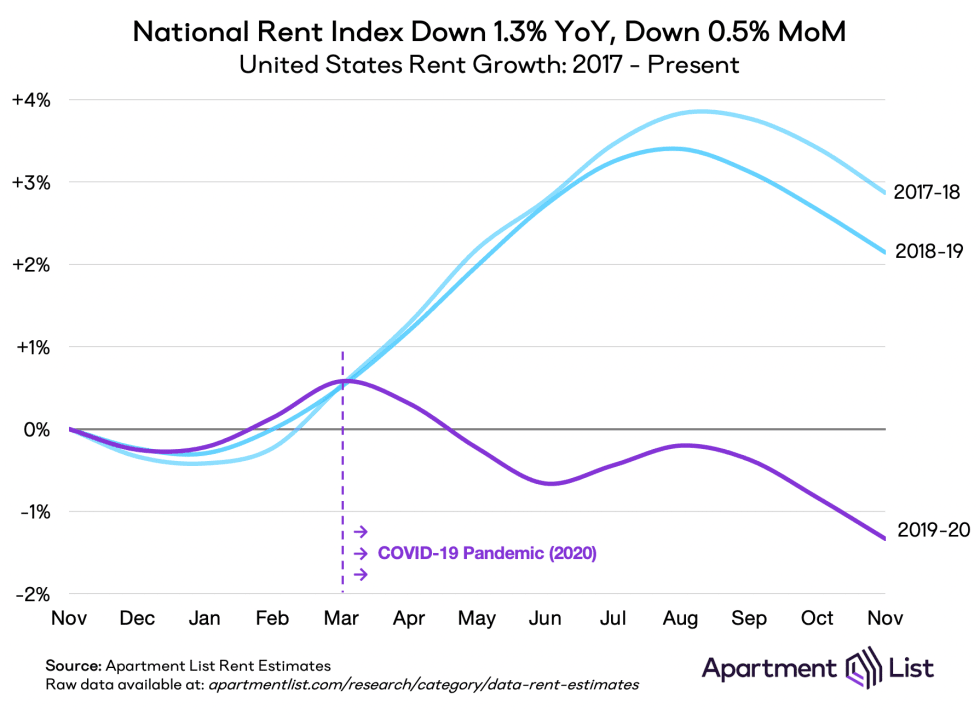
At the national level, 2020 can be broken into three distinct phases:
Today rents may be moving along a normal trajectory, but a national-level rent index masks a tremendous amount of regional variation taking place under the surface. November has brought a modest, predictable 0.5 percent reduction in rents, but that half-percent is a blend of a few large cities where rents are dropping quickly and many other smaller cities where rents are more stable, if not rising. Last year, 77 of the nation’s 100 largest cities saw rents drop in November; this year, the number is just 64. Fewer cities got cheaper, but those cities got cheaper faster. This aggregates to a national trend that appears similar to last year but hides some new trends. Most notably, the nation’s smaller, more-affordable markets have absorbed most of the summer’s rent rebound, while larger, more-expensive markets have been saddled with unrelenting price drops.
Rent Declines Are Concentrated in Large, Expensive Markets
A sample of the nation’s 50 largest cities highlights the degree to which COVID-19 has disrupted the rental market in expensive cities. Below we visualize the relationship between rent levels and rent changes. There is a clear correlation between the two; the cities that had the highest rents in March (moving right along the x-axis) have seen the steepest rent drops since then (moving down along the y-axis).
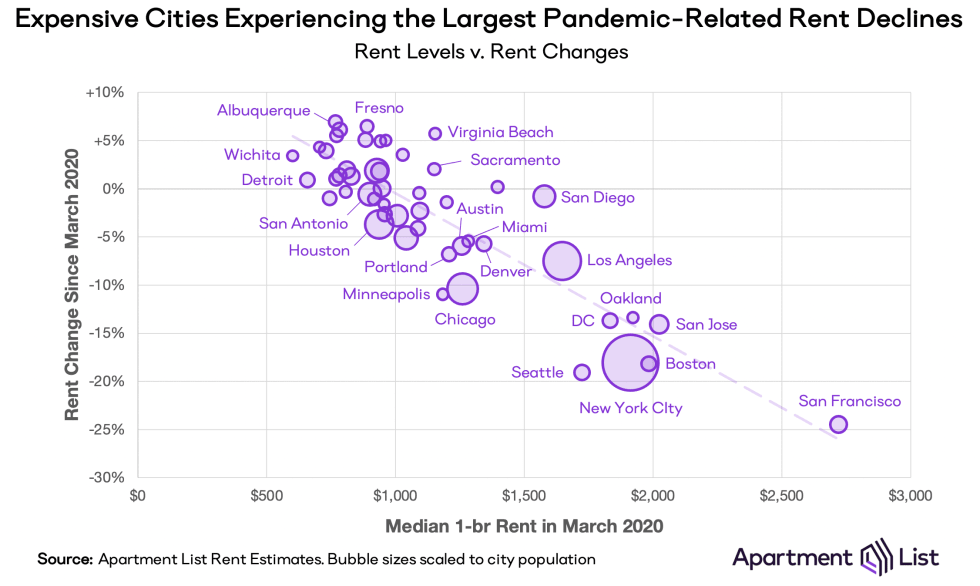
As the most-expensive and most-impacted city in the country, San Francisco leads the pack. With a rent decline of 24.5 percent since March, the median 2-bedroom apartment in San Francisco has dropped from $3,147 to $2,377. Following San Francisco as a cluster of expensive coastal markets that have also been heavily impacted.
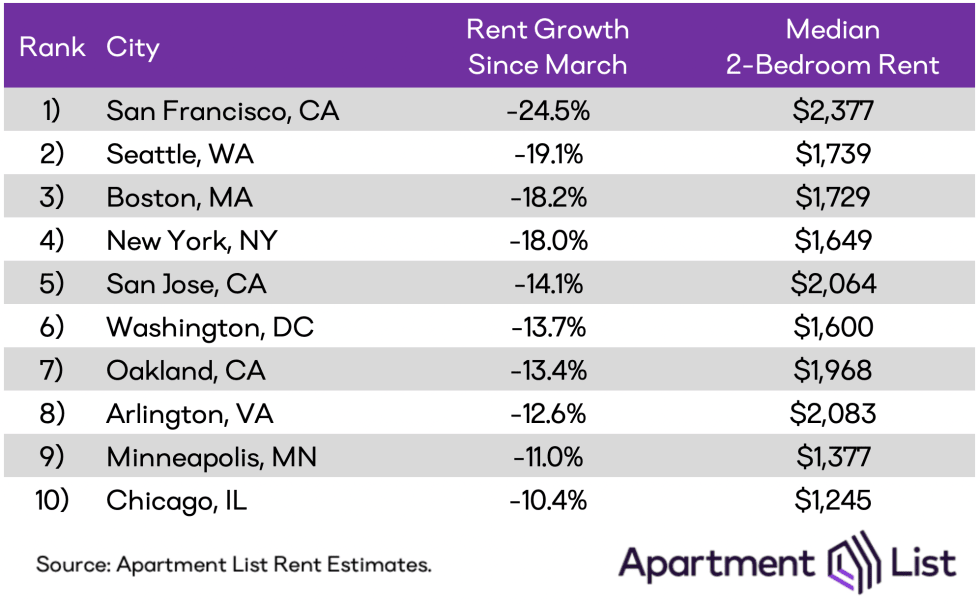
Seattle and Boston had the nation’s most dramatic November rent drops (5.6 percent and 5.2 percent, respectively), pushing them past New York which had previously occupied the number 2 spot throughout most of the summer. Today, Seattle ranks second with a 19.1 percent rent decline since March, Boston ranks third, New York City falls to fourth, and San Jose rounds out the top five. All of the cities in this list have lost more than 10 percent of their rent prices during the pandemic months.
Note that these are all some of the most expensive markets in the country, and they all have a high share of their workforces employed by the sorts of companies that are quick to embrace remote work. No longer needing to be close to the office, and with many local amenities still closed, some of these workers may be questioning their choice of location. Furthermore, workers who have been laid off or furloughed in these cities likely have little buffer to continue affording sky-high rents. Coupled with the seasonal trends mentioned earlier, these factors have led to a softening in demand that has caused some of the sharpest rent dips on record in these cities.
In Affordable Midsize Cities, Rent Growth Accelerates
While the pandemic and related economic uncertainty have generally caused a slowdown in rental activity, some cities have actually seen rent growth accelerate in recent months. In Boise, rents have increased by more than 9 percent since March, more than double the rent growth it experienced during the same period last year. Our rental price data is mirrored by evidence that Boise’s for-sale market has also been heating up. As the priciest cities lose some of their allure, interest in more affordable mid-sized cities appears to be picking up, potentially driven in part by renters taking advantage of remote work arrangements. As many of us continue to spend the majority of our time at home, it is unsurprising that some are now seeking out new locations where they can afford more space.
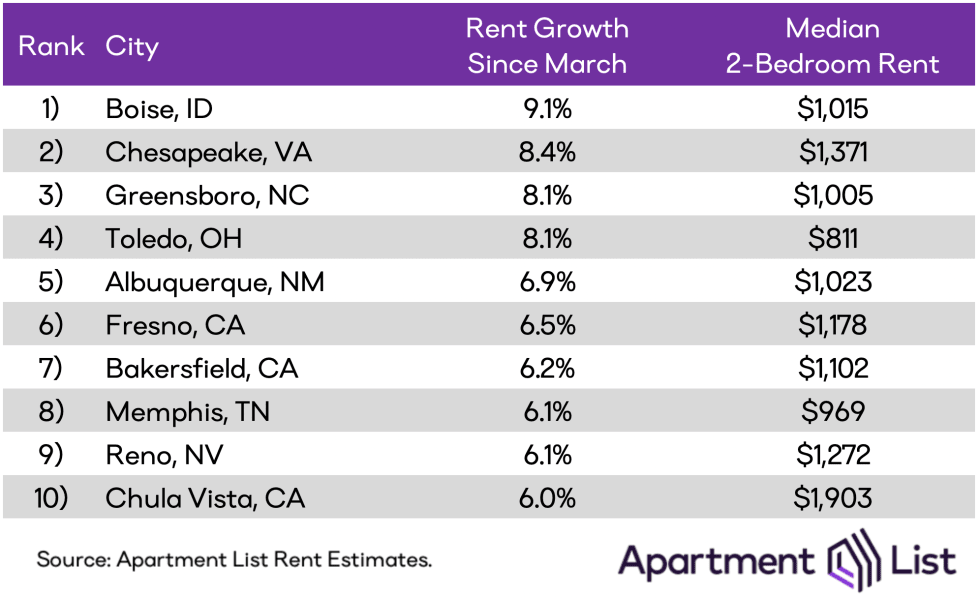
While we may be seeing the early signs of renters making housing choices independent of where their jobs are located, many of the cities with the fastest rent growth are still within commuting distance of larger job centers. For example, Greensboro, NC is within a 90 minute commute of Charlotte, Chula Vista, CA is a nearby suburb of San Diego, and Riverside, CA – which lands just outside the top 10 with 5.9% growth since March – is a commuter city for Los Angeles. And though the drives are longer, it would also be feasible to make the occasional trip from Chesapeake, VA to Washington, DC or from Reno, NV to the Bay Area. This trend may indicate that even workers who are planning for a permanent shift toward remote work still value the option to go into the office when needed.
Another way to visualize this trend is to split our rent data into two groups: principal cities and suburban cities. Per the Census Bureau, principal cities are the cities that lie at the core of each metropolitan area. They are typically the metro’s largest and they generate the greatest economic output. Suburban cities, on the other hand, are the remaining non-principal cities within each metro. For example, San Francisco is a principal city while Oakland and Berkeley are suburbs, and New York City is the principal city while Newark and White Plains are suburbs.
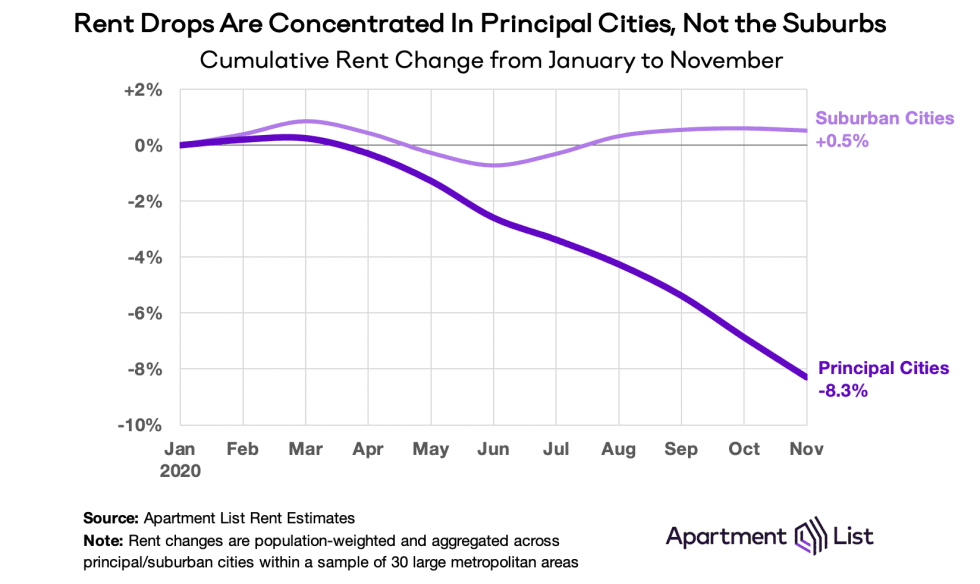
In suburban cities, rents have rebounded quickly and sit 0.5 percent higher today than they did at the start of the year. Meanwhile, rents in principal cities have fallen steadily and are 8.3 percent lower today than in January. In 27 of the nation’s 30 largest metropolitan areas, principal cities are experiencing faster rent drops than their surrounding suburbs. For a deeper dive on this urban/suburban divide, or to explore rent trends within a specific metropolitan area, please see our recent report: The Suburban Rent Rebound.
Conclusion
Since the start of the COVID-19 pandemic, we have seen shelter-in-place ordinances put a halt to normal moving activity, combined with staggering job losses as huge segments of the economy were put on pause. Although some laid off and furloughed workers have been brought back, the unemployment rate remains startlingly high, and the economic recovery is likely to be slow and gradual. This heightened financial hardship has led to an increase in downgrade moves as many Americans are forced to look for more affordable housing options.
At the same, there is evidence that a growing embrace of remote work will outlast the pandemic, which could significantly alter the housing choices of workers in these flexible arrangements. Amid this backdrop, we’re seeing a sharp dropoff in demand for expensive rental units in cities like San Francisco and New York, while more affordable midsize cities such as Boise are continuing to heat up.
To learn more about the data behind this article and what Apartment List has to offer, visit https://www.apartmentlist.com/.


Sign up to receive our stories in your inbox.
Data is changing the speed of business. Investors, Corporations, and Governments are buying new, differentiated data to gain visibility make better decisions. Don't fall behind. Let us help.


Sign up to receive our stories in your inbox.
Data is changing the speed of business. Investors, Corporations, and Governments are buying new, differentiated data to gain visibility make better decisions. Don't fall behind. Let us help.