Black Friday is historically the most popular holiday shopping day in the United States. As Thanksgiving ends and retailers offer special discounts, millions of shoppers flock to stores to get a jumpstart shopping for gifts.
However, even before COVID-19 many consumers chose to avoid in-store crowds by shopping Black Friday deals online, or venturing to the stores later in the day. Brick-and-mortar shopping sales increased by 4.2% on Black Friday in 2019, while online shopping sales surged by 14%. Given current social distancing protocols and the rapidly increasing popularity of online shopping, Black Friday 2020 was destined to see an acceleration in the shift to e-commerce.
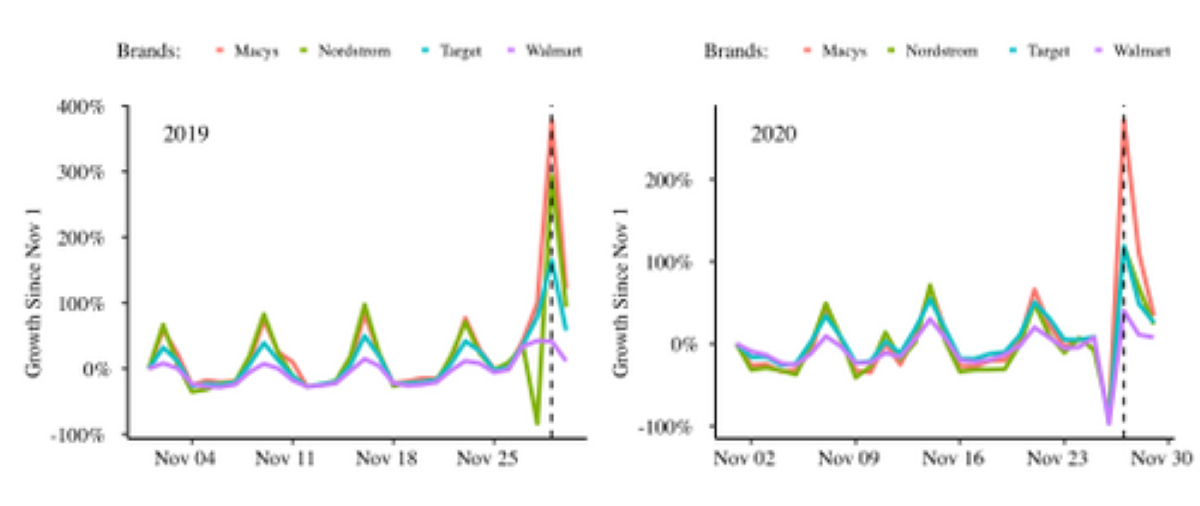
This assumption is confirmed when looking at foot traffic data to four major U.S. retailers on Black Friday in 2019 and 2020. Black Friday 2019 foot traffic to Macy’s was 378.2% higher than on November 1, 2019. In 2020, when Macy’s has already seen a decrease in foot traffic, Black Friday still brought an increase of in-store visits, but only by 272% of visits on November 1, 2020. Overall, Macy’s Black Friday foot traffic bump (the increase compared to other November Fridays of that year) was 17.6% smaller in 2020 than it was in 2019.
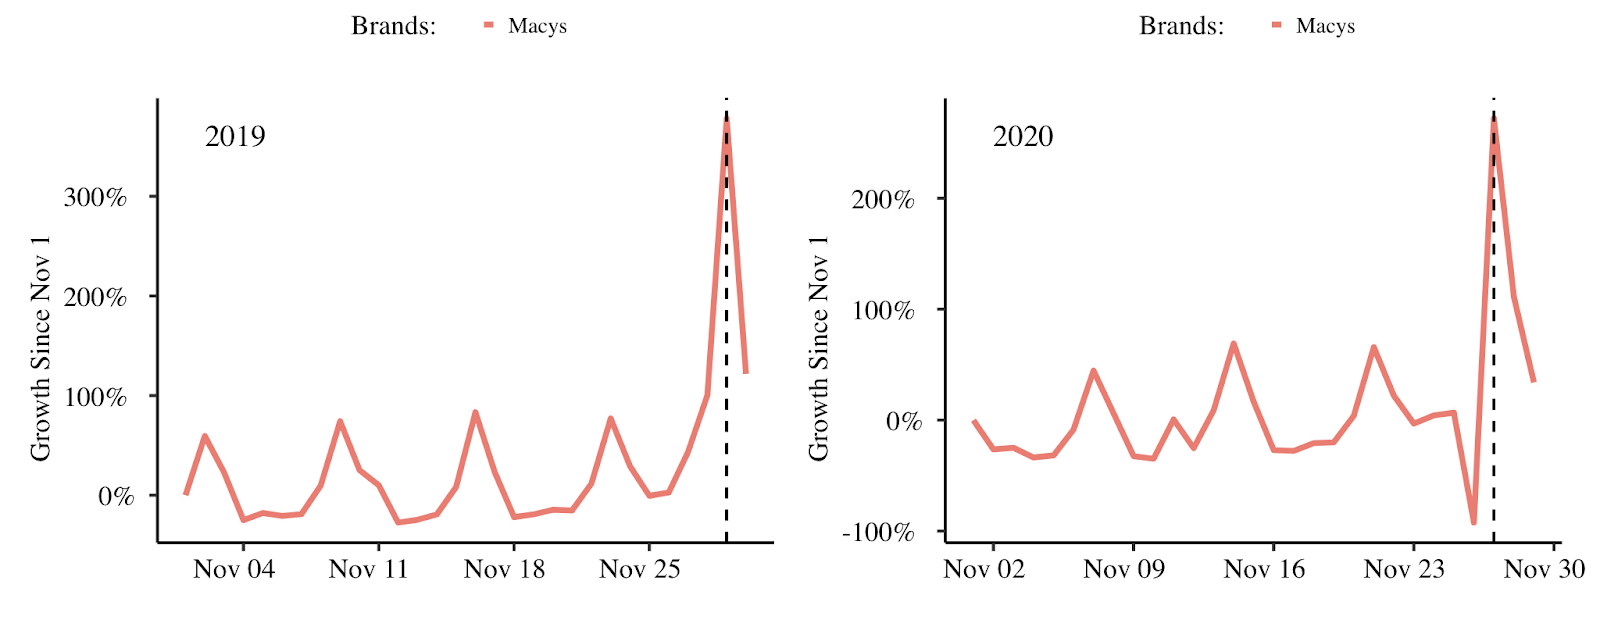
Black Friday foot traffic compared to November 1 of that year.
Nordstrom had the biggest difference between Black Friday bumps in 2019 and 2020, at -40.4%. In 2019, Nordstrom’s Black Friday foot traffic was 293.6% of its November 1 foot traffic, while in 2020 it was 118.8%. Like Macy’s, Nordstrom has also seen a general decrease in foot traffic during the pandemic, so 118.8% of a pandemic-level weekend (all stores studied experienced increases in foot traffic on weekends in 2019 and 2020) represents a significant decrease in Black Friday visits.
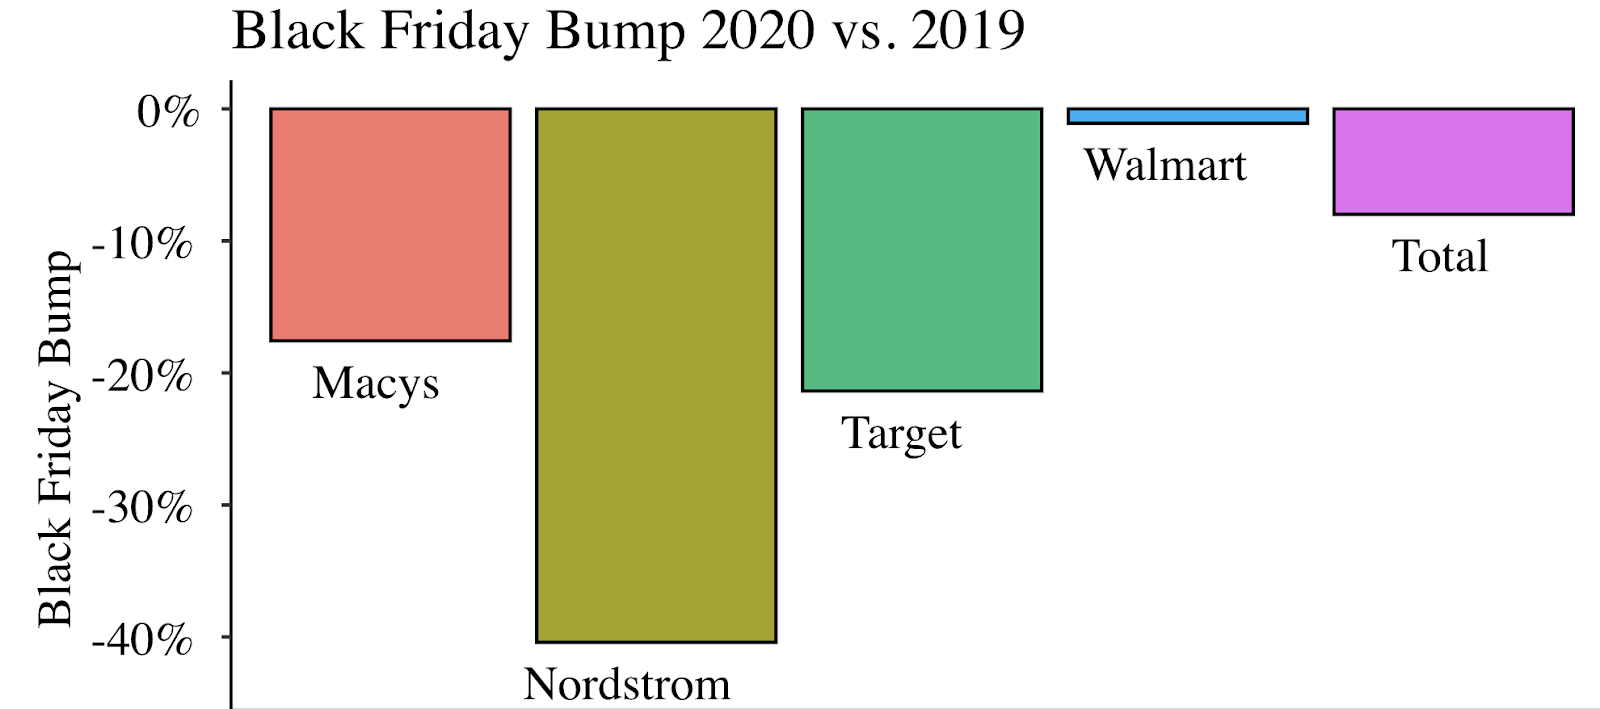
Black Friday bumps represent the percentage difference in foot traffic compared to other Fridays in November.
Interestingly, in 2019 Nordstrom was the only store to see a sharp decline in foot traffic on Thanksgiving day, while in 2020 all four stores analyzed (Macy’s, Nordstrom, Walmart, and Target) had between 88-97% less foot traffic than on November 1st. This is most likely due to many stores closing on Thanksgiving this year - perhaps a few disappointed shoppers ventured out without knowing this, which would account for the remaining 3-12%
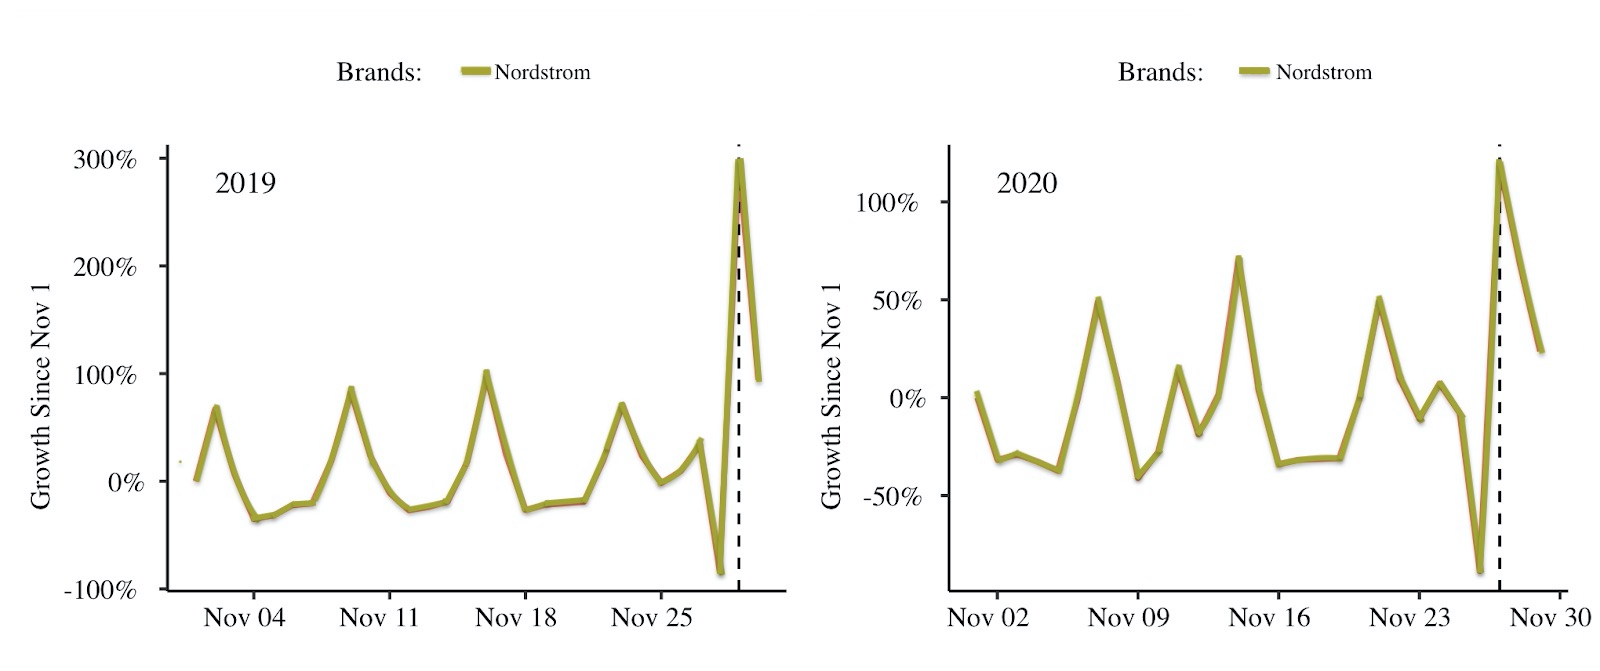
Black Friday foot traffic compared to November 1 of that year.
When comparing most popular in-store shopping times on Black Friday in 2019 vs 2020, Nordstrom also had the most variation. Macy’s, Target, and Walmart foot traffic density by hour only varied by at most 2% between 2019 and 2020, indicating that despite the decrease in Black Friday shopping volume, shoppers that did visit those stores went at roughly the same times as in a normal year. On the other hand, Nordstrom had much stronger variation in foot traffic density by hour between 2019 and 2020. While Macy’s, Target, and Walmart foot traffic density hovered around the same levels, Nordstrom experienced sharp decreases in foot traffic density in the late morning and sharp increases in the afternoon.
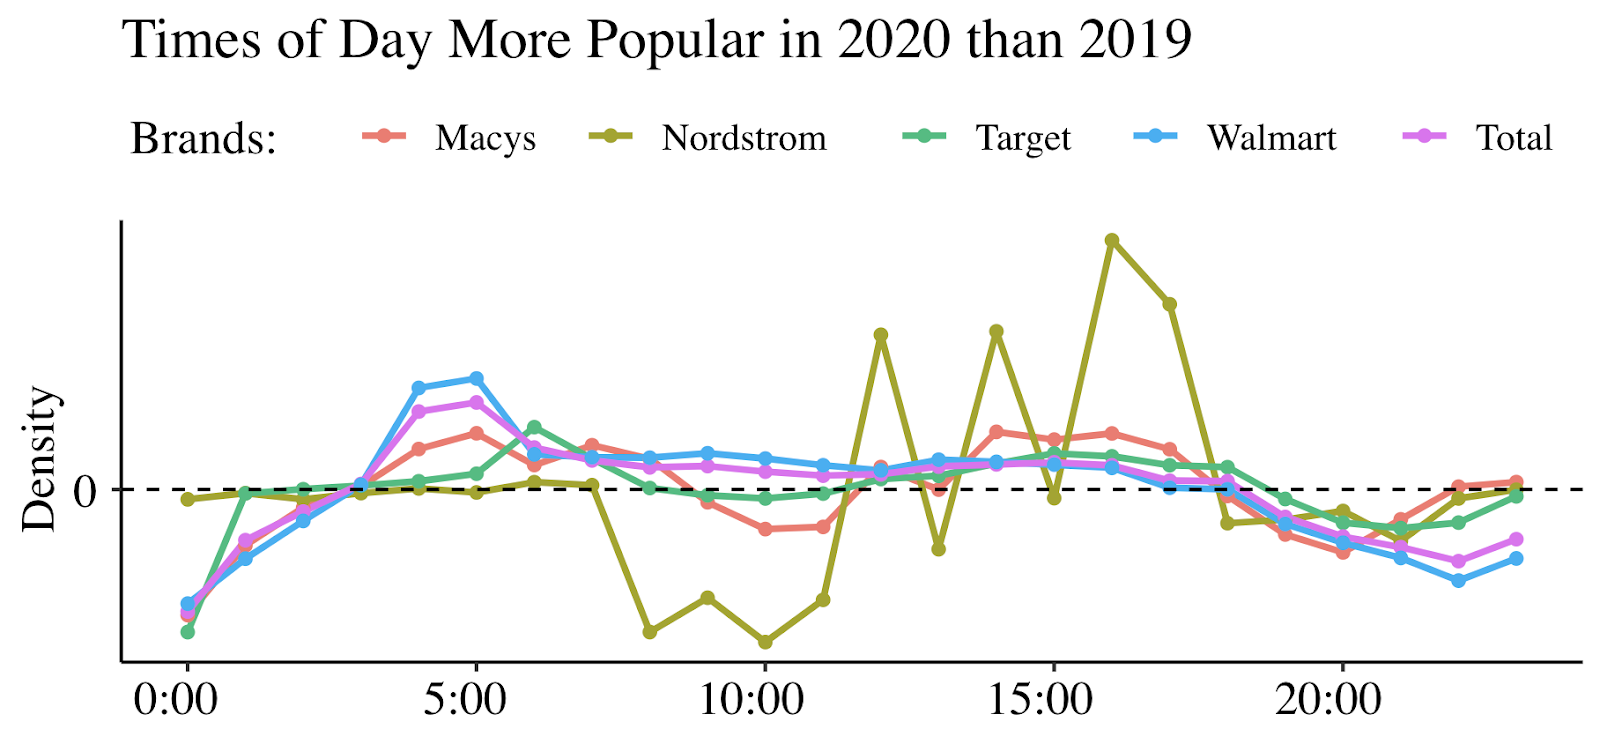
Foot traffic density variation by hour in 2019 vs 2020.
Black Friday foot traffic in both 2019 and 2020 varied by geography. While on average the four stores analyzed saw decreases in the Black Friday bump between 2019 and 2020, some states saw increases. Stores in North Dakota, Florida, South Dakota, Washington D.C., Georgia, South Carolina, and North Carolina all had a positive Black Friday bump from 2019 and 2020. It’s important to again note that this is relative to foot traffic on other Fridays in November of those years. This means that even in the midst of the pandemic, the percentage increase in foot traffic on Black Friday compared to other 2020 November Fridays was larger than the same measurement in 2019. The four stores saw a decreased Black Friday foot traffic bump in all other states.
Given this data, it’s not surprising that online sales reached a new record on Black Friday this year. Explore foot traffic data by brand and geography in this interactive dashboard, powered by SafeGraph Patterns data.
To learn more about the data behind this article and what SafeGraph has to offer, visit https://www.safegraph.com/.


Sign up to receive our stories in your inbox.
Data is changing the speed of business. Investors, Corporations, and Governments are buying new, differentiated data to gain visibility make better decisions. Don't fall behind. Let us help.


Sign up to receive our stories in your inbox.
Data is changing the speed of business. Investors, Corporations, and Governments are buying new, differentiated data to gain visibility make better decisions. Don't fall behind. Let us help.


