As the COVID recovery progresses, our customers are eager to track changes in return to work across the country. This example shows how SafeGraph Patterns data was used to analyze how suburban, city, and downtown regions of Chicago have recovered since the pandemic commenced. Four major brands, Starbucks, Dunkin’, McDonald’s, and Subway, were selected as proxies for POI that workers would visit as they return to the office.
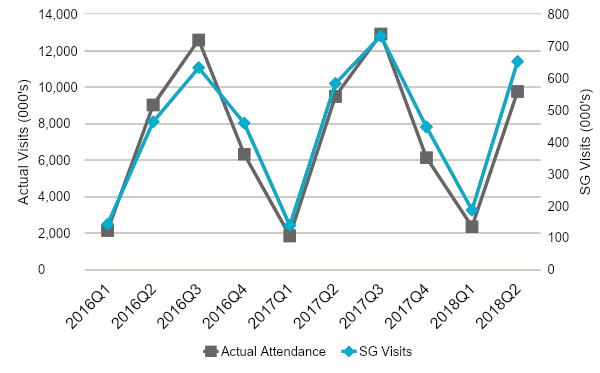
People eat more ice cream in the summertime. As statements go, that one isn’t likely to make an anthology of insightful wisdom anytime soon. It turns out, however, that it actually has significant implications for how we assess general liability (GL) risk. The risk of most GL perils like slip, trip, and fall (ST&F) is directly related to the number of people who are exposed to the peril. The more people that walk over a patch of ice, the greater the chance that someone will slip on it.
How strictly have businesses been adhering to COVID restrictions? We'll be taking a look at Washington State, which has a COVID reopening plan that staggers reopening phases by county. Why is this handy? Because we can look at the "reopening phase" changing in some counties but not others. This gives us a baseline of behavior in places where the rules aren't changing, so we can see if people actually change their behavior when the rules change.
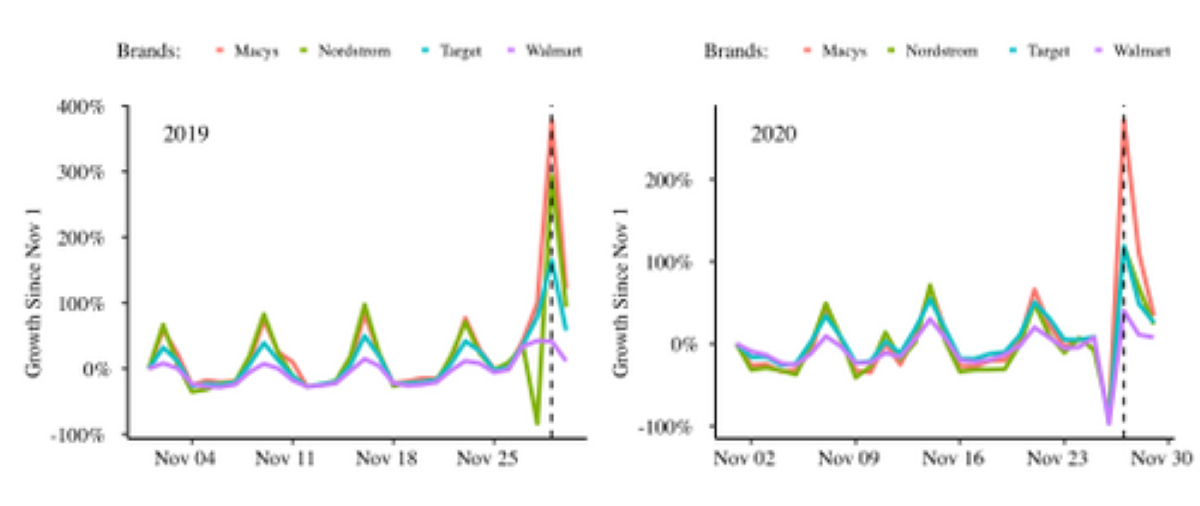
Black Friday is historically the most popular holiday shopping day in the United States. As Thanksgiving ends and retailers offer special discounts, millions of shoppers flock to stores to get a jumpstart shopping for gifts.
The 2020 United States presidential election was historic in many respects, but perhaps most notably for its record-breaking voter turnout. While encouraging voters to participate is a priority in any election, the unique circumstances brought by a global pandemic posed new challenges. One response to this was the implementation of early voting in most U.S. states.
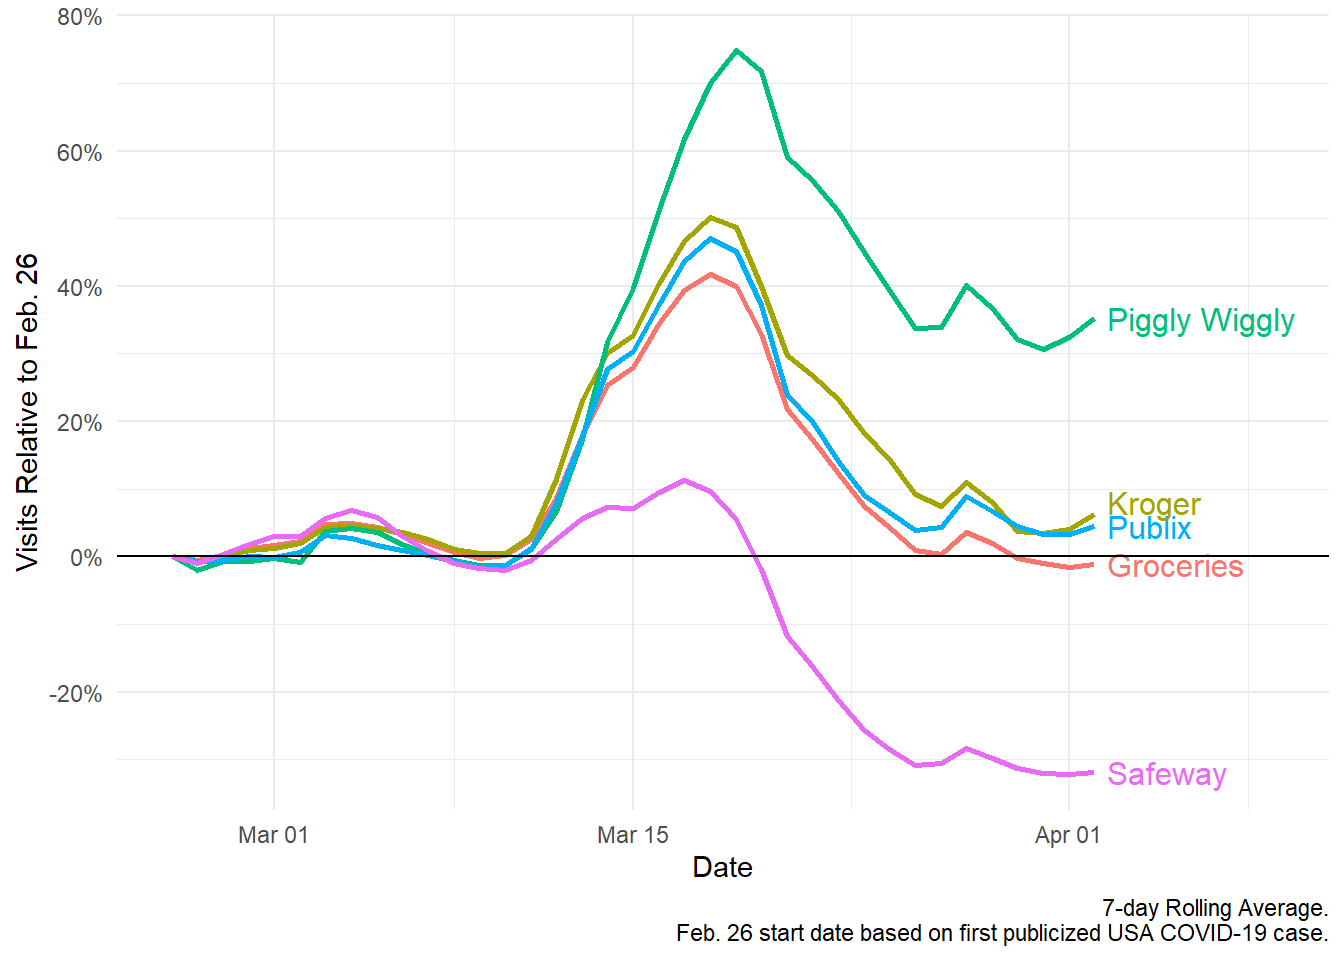
In the charts that follow, we’ll look at SafeGraph’s weekly foot traffic patterns dataset to take a closer look at what’s becoming more and more of a tenuous relationship between consumers and grocery stores—as well as a few other select food service businesses—as we get closer to the peak of the COVID-19 crisis here in the U.S.
Social distancing and stay-at-home measures are in full swing across the U.S. But as SafeGraph’s Shelter-In-Place dashboards show, not everyone is hunkering down at home in the same way. This begs the question: what’s driving these different responses in each state?