SafeGraph datasets show volatile consumer activity as Americans adjust to the “new normal” caused by the novel coronavirus pandemic
Life, as we know it, has fundamentally changed across the United States. As early as late February, it was more or less business-as-usual and then, almost overnight, all kinds of businesses started shutting down left and right as social distancing and “stay at home” measures were becoming increasingly enforced across the country.
Grocery stores have been a rare exception to this rule. Deemed as “essential” businesses by local, state, and federal authorities, they have been operating around-the-clock since the threat of COVID-19 became more ominous with each passing day.
Now, while you may think that grocery stores would be more in demand now than ever before, especially based on what you’ve likely seen played out in the news around frenzied hunts for toilet paper and disinfectant products, we had a feeling there was another story to tell that wasn’t being conveyed in the media. So, we did what we do best and looked to SafeGraph Patterns foot-traffic data to understand and visualize how consumer activity has shifted in response to COVID-19 over the last few weeks. This led to the creation of our COVID-19 U.S. Consumer Activity Foot Traffic dashboard (updated daily!) and Social Distancing Metrics.
In the charts that follow, we’ll look at SafeGraph’s weekly foot traffic patterns dataset to take a closer look at what’s becoming more and more of a tenuous relationship between consumers and grocery stores—as well as a few other select food service businesses—as we get closer to the peak of the COVID-19 crisis here in the U.S.
It’s not surprising that consumers almost immediately went into panic mode the minute they heard the words “travel ban,” “shutdown,” “isolation,” and “quarantine” being said on repeat in the news and across all social media channels.
Of course, not knowing how long this unprecedented health and economic crisis would play out, many consumers made a mad dash to grocery stores to stock up in near-apocalyptic ways. This was most pronounced immediately after President Trump announced, on March 16, 2020, that all flights between the U.S. and Europe would be canceled for at least 30 days.
Within no time, grocery store shelves were empty. Let’s take a look at the charts below.
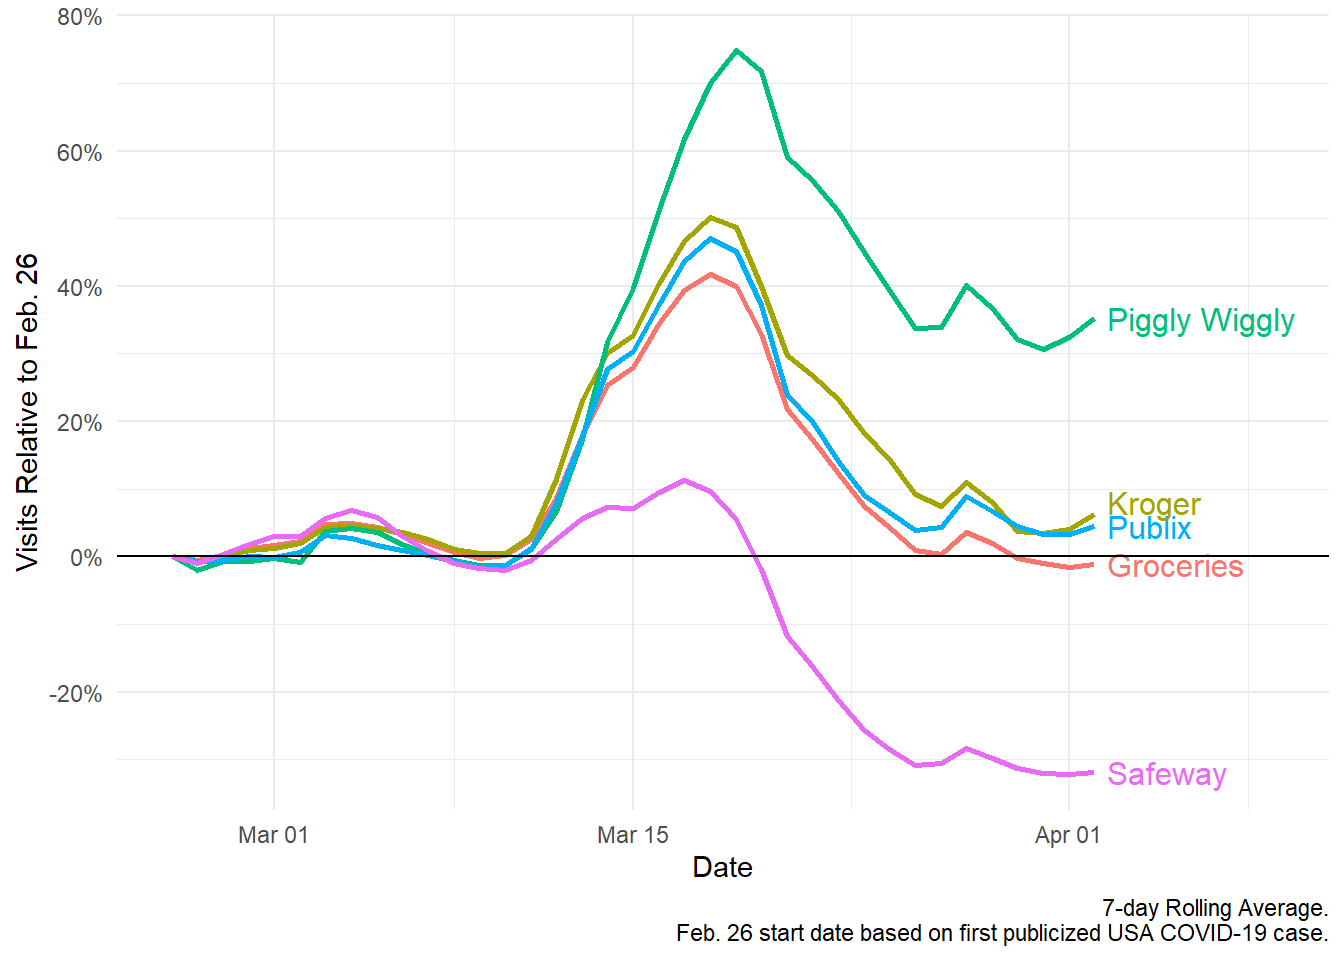
Daily percent change in foot traffic for various grocery store chains, relative to February 26, 2020.
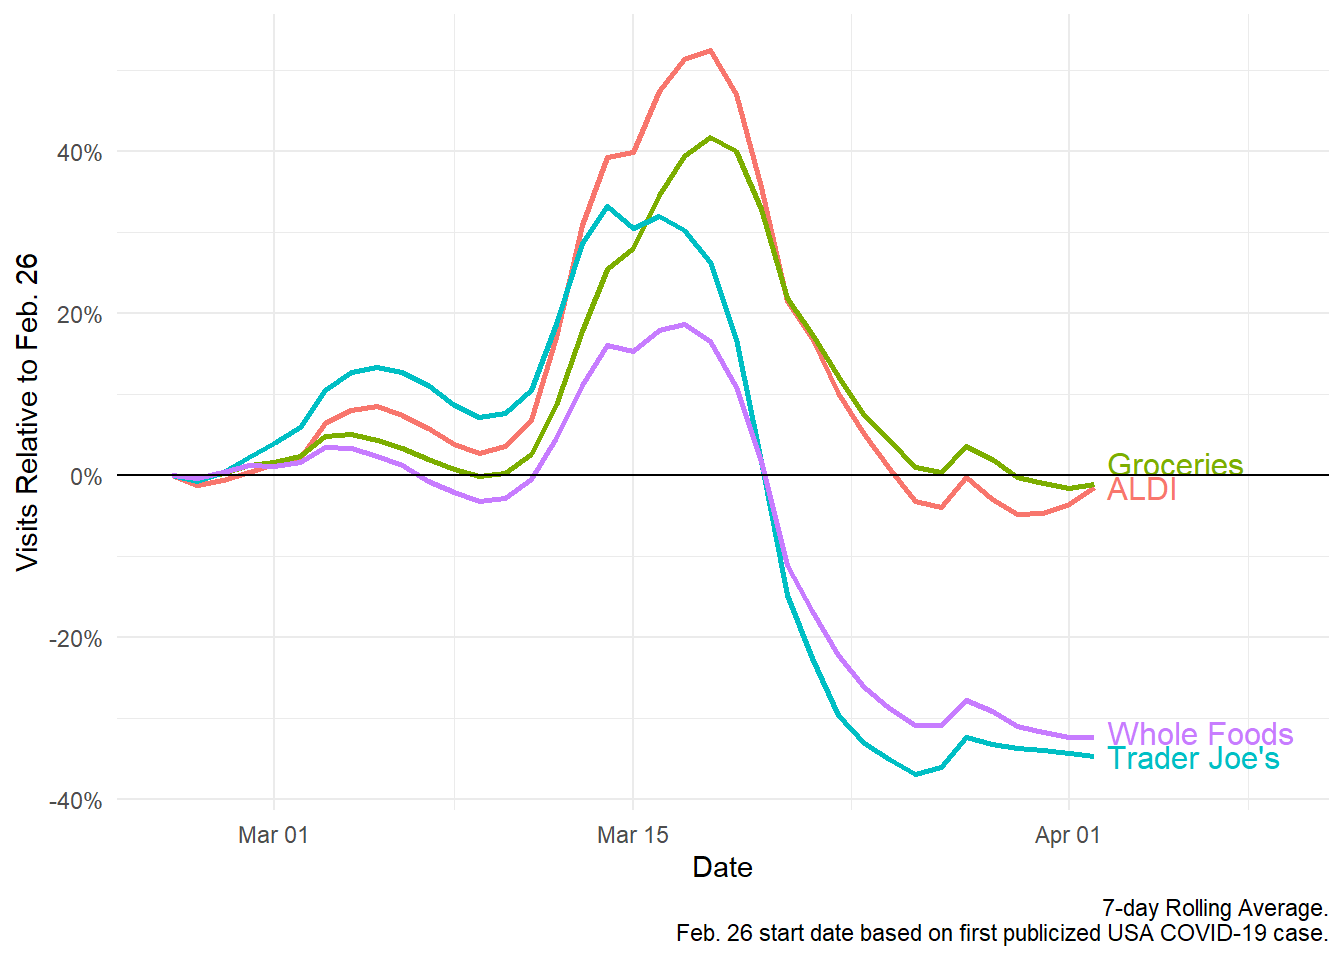
Daily percent change in foot traffic for various grocery store chains, relative to February 26, 2020.
Here, we decided to look at day-to-day foot-traffic in a handful of grocery and “big box” store chains over a roughly 30-day period and compare it against presumably “normal” foot traffic on February 26, 2020. This date was just a few days before the first coronavirus-related death was reported in the U.S. For us, this was a great way to measure and visualize the immediate and daily change in consumer behavior as the crisis progressed.
Not surprising, as media coverage around COVID-19 began to intensify in early March, we noticed a slight initial increase in grocery store visits—likely fueled even more by the public cancelation or postponement of events like SXSW, Coachella, and March Madness. This was then followed by a brief dip back to “normal” foot traffic levels around March 9, 2020.
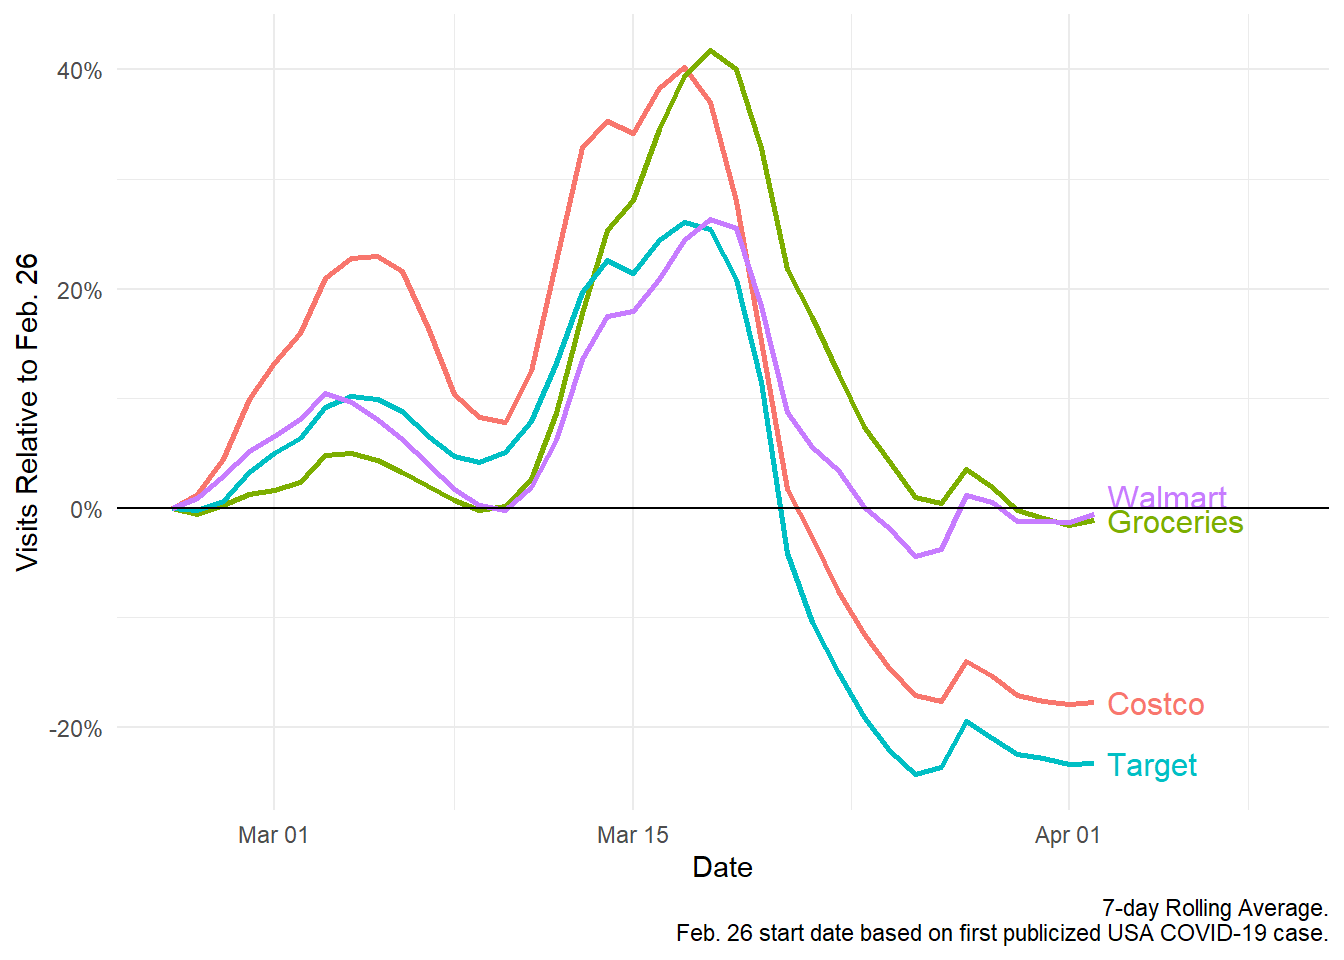
Daily percent change in foot traffic for “big box” brand chains, relative to February 26, 2020.
Then, the virus started spreading—and, as a result, began to co-opt media coverage. Even though the U.S. government wasn’t ready to admit the severity of the situation, many states began enforcing social distancing measures (of varying levels) and encouraging people to stay at home as much as possible. Panic started to set in, and people began thinking about how they could prepare should they be forced to stay at home at all times. Stocking up on essential items at the grocery store, therefore, became an absolute priority.
This so-called “panic shopping” peak started to take shape soon after the European travel ban was announced on March 12, 2020, reaching its highest point between March 17–19, 2020 for most stores, where, on average, foot traffic peaked by nearly 42%. In many ways, you could say this officially marked the moment when most Americans realized that life was about to change dramatically in both the near- and long-term.
But then something very interesting started happening. Now that people were well-stocked for weeks, if not for months of food and supplies, foot traffic to both grocery stores and big box brands started to taper almost as quickly as it spiked. Even more interesting, however, is that by March 20, 2020 (give or take), foot traffic for many stores—including Safeway, Whole Foods, Trader Joe’s, Costco, and Target—dipped well below the norm established on February 26, 2020.
This could be attributed to a number of factors: people taking social distancing measures more seriously, people staying at home, people shopping online and having their groceries and supplies delivered, and so on. This is likely further accentuated by the fact that many stores have now also implemented social distancing measures, store capacity limits, and additional health, safety, and sanitation precautions to protect their customers and employees.
Other food service brands, like Starbucks and McDonald’s (see chart below), experienced similar trends in early March, but, as opposed to grocery stores, store visits for these businesses took a serious and sustained dip the moment the travel ban was announced.
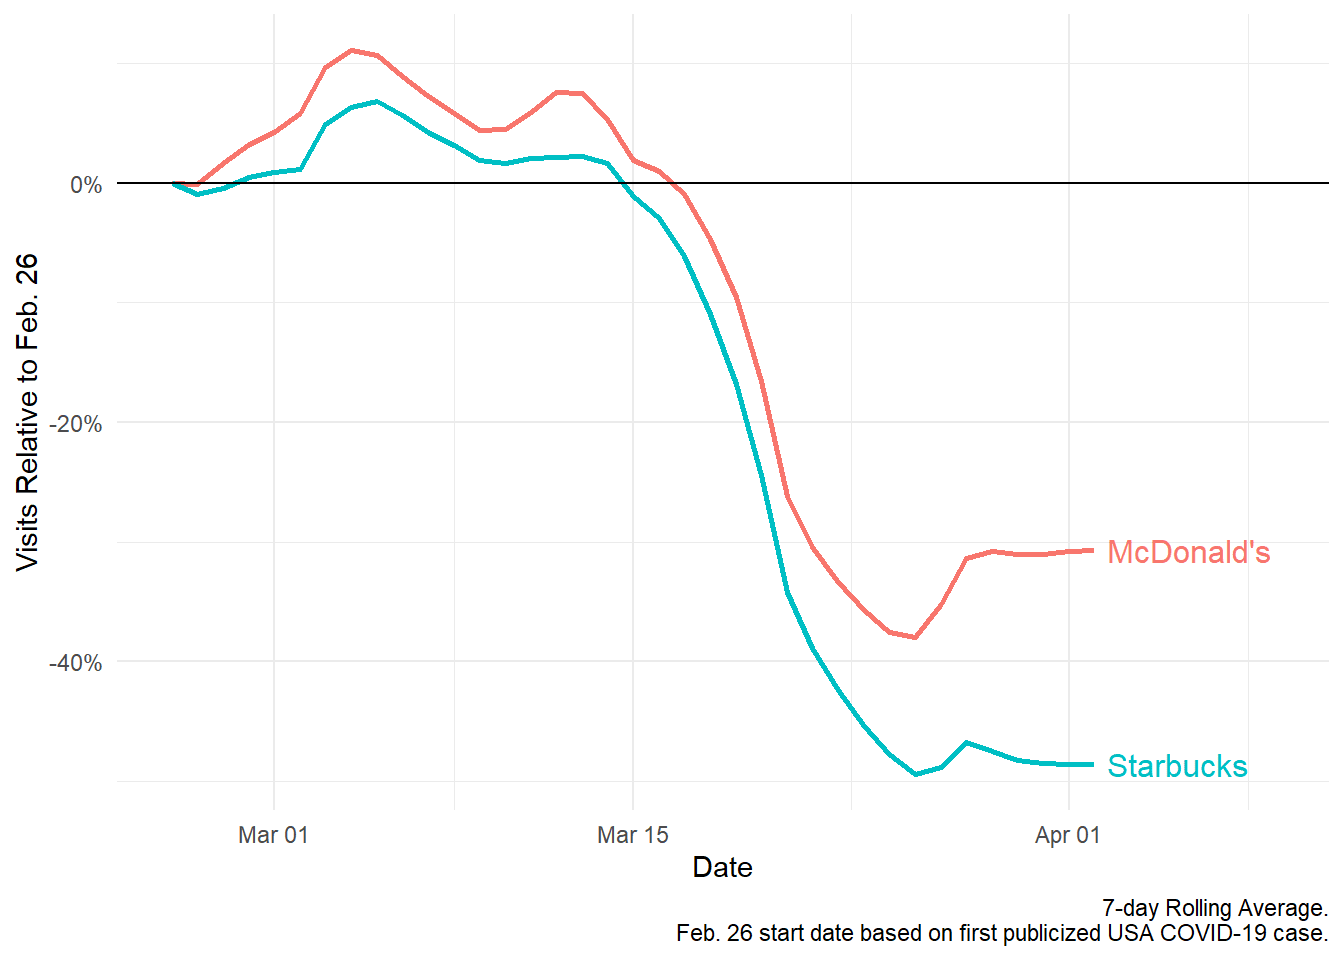
Daily percent change in foot traffic to McDonald’s and Starbucks, relative to February 26, 2020.*
While these establishments remained open for most of March, both food service brands instituted take-away or drive-thru only policies; in other words, people were no longer able to sit and enjoy their purchase within the restaurant itself. And on March 22, 2020, Starbucks announced that it would close the majority of its stores in the U.S. for two weeks. This came after the coffee chain had already experienced a 34% decrease in foot traffic since February 26, 2020. And as people become increasingly wary of being out in public, the question remains (especially for brands like McDonald’s): when will this downward trend finally level out?
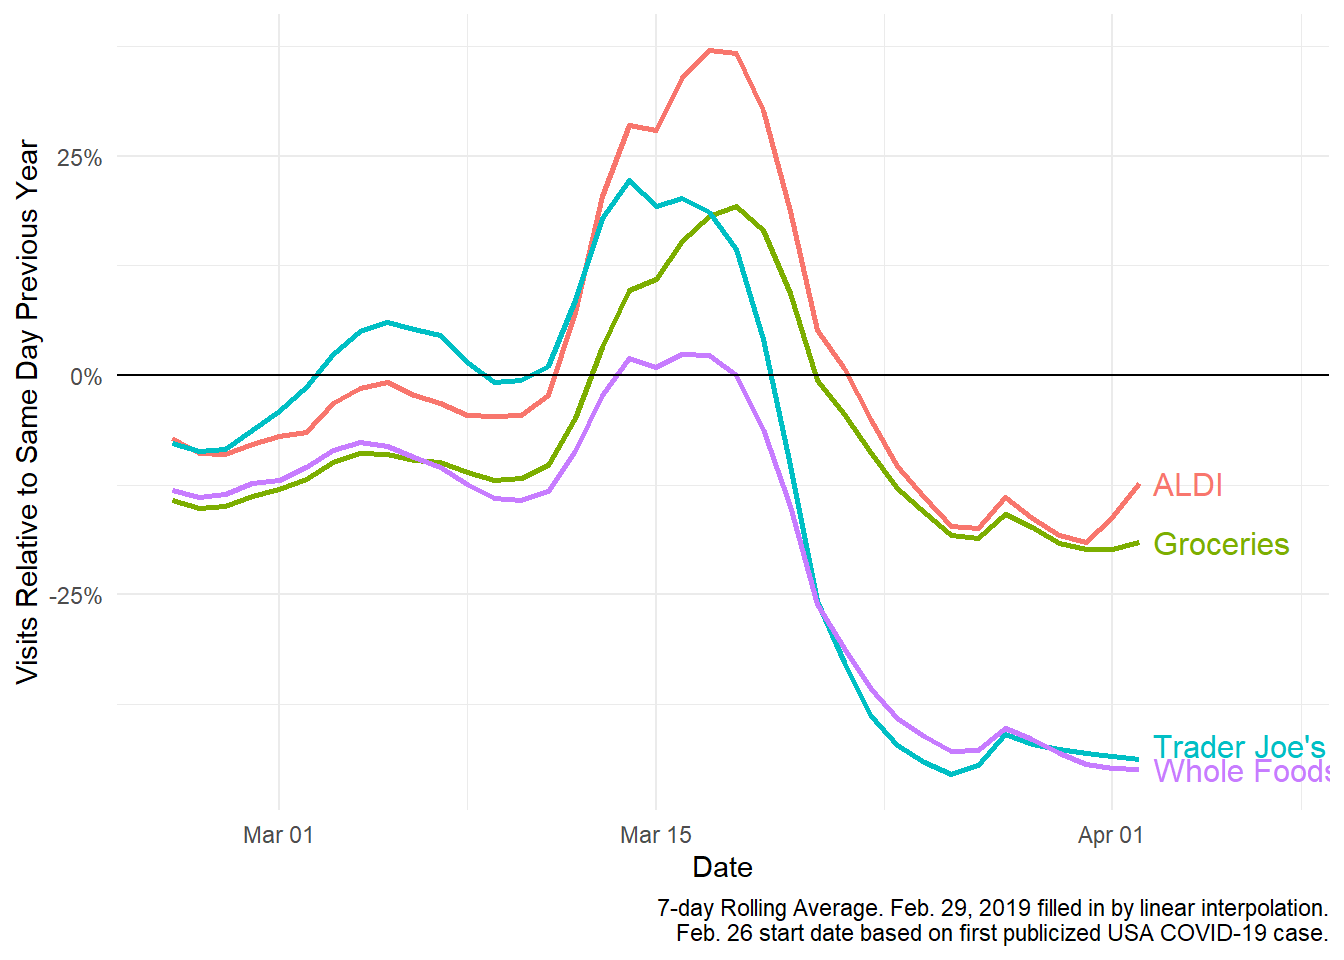
Obviously, this year is unlike any other. As COVID-19 has spread around the world, consumers have responded to the threat of the virus in a relatively knee-jerk way. We knew that by looking at this year’s data alone, we wouldn’t be able to paint the most complete picture around the impact that COVID-19 has had on consumer activity. So, we decided to add another layer to our analysis, comparing the difference in same-day foot traffic between this year and the same time period from last year (February 26-April 2, 2019).
Not surprisingly, we still see the same “panic shopping” spikes as we did in the charts above. What’s more interesting, however, is that relative y/y foot traffic for this year was already down by nearly 20% from a year ago, from February 26 and into early March for most grocery stores. This could perhaps be attributed to the growth of delivery services and delivery apps, like Instacart, making it easier than ever for consumers to avoid grocery stores altogether.
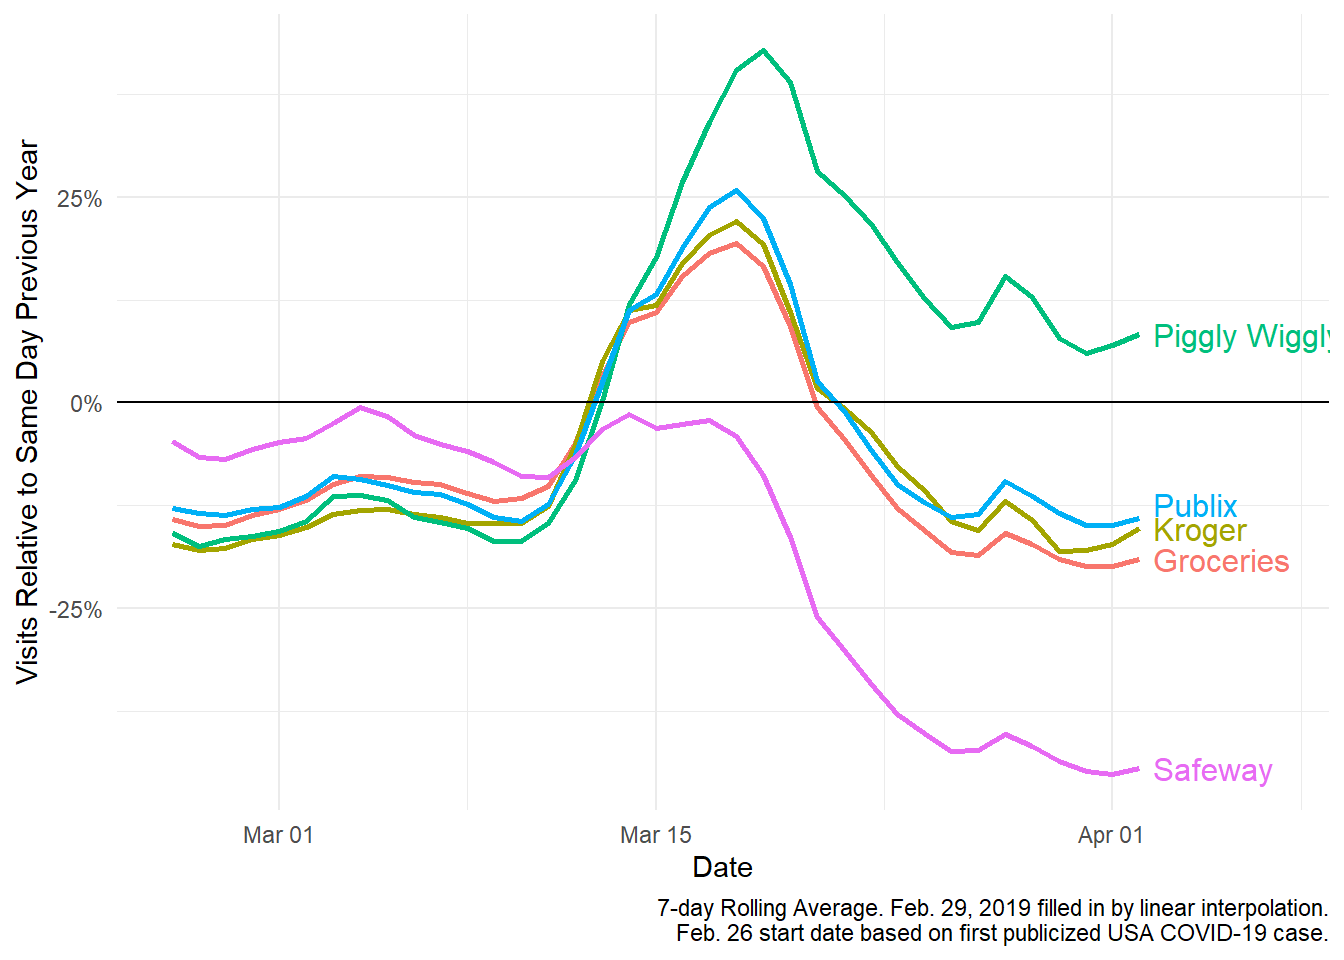
Daily percent change in foot traffic for various grocery store chains, relative to the same day in 2019.
Daily percent change in foot traffic for various grocery store chains, relative to the same day in 2019.
This, combined with aggressive social distancing measures, has led to a 19% drop in y/y foot traffic to grocery stores by April 2, with Piggly Wiggly the only store in the set still holding strong with an eight percent y/y increase. Safeway, on the other hand, hasn’t fared as well, ending this period with a nearly 45% decrease in total foot traffic y/y.
Much of the same can be said when we turn our attention to big box brands as well (see chart below). Though, interestingly enough, among the big box brands we tracked, only Walmart stood out as the brand experiencing consistently negative foot traffic growth y/y during this period. This is likely attributed to the company’s continued investment in its Amazon-like delivery service, which has helped Walmart customers become more accustomed to transacting with the brand and making their purchases online. Overall, big box stores suffered a more serious blow to y/y foot traffic versus their grocery store counterparents, with Costco and Target dropping in total foot traffic by 32% and 34%, respectively.
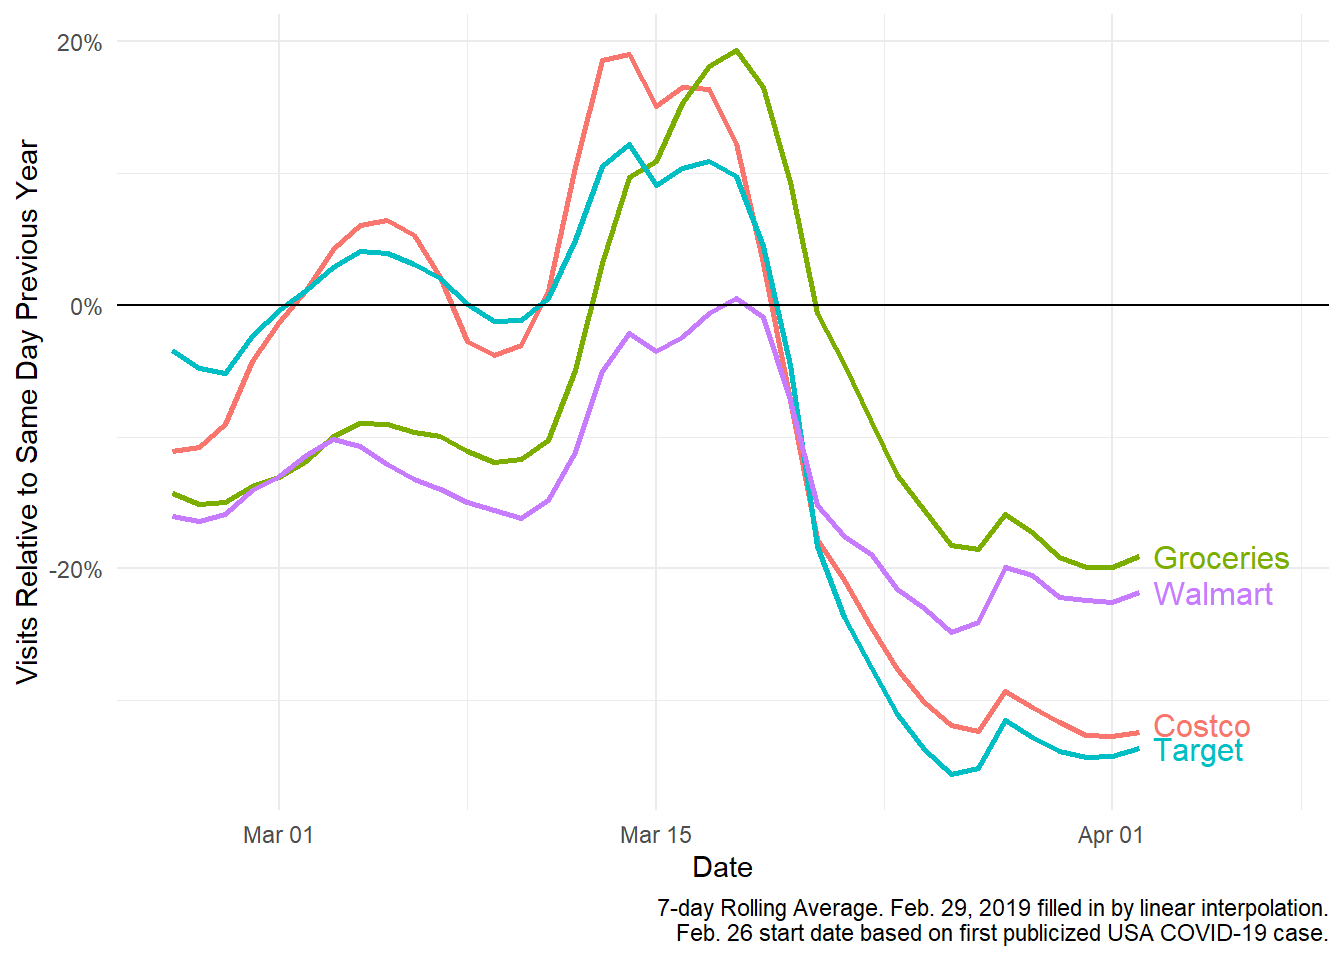
Daily percent change in foot traffic for “big box” brand chains, relative to same day in 2019.
So, what happened to McDonald’s and Starbucks? When comparing foot traffic patterns y/y, you still see the drop in foot traffic—in this case, it’s even more extreme than in the 2020-only data above—but what’s most important to note here is that relative foot traffic to both brands was hovering already in negative territory: both brands were already seeing fewer in-store visitors to begin with. The arrival of COVID-19 just accentuated that negative trend even further, leaving Starbucks with an overall 56% decrease in foot traffic y/y during this time period, prior to the shuttering of most its stores for two weeks, and McDonald’s with an overall 45% decrease.
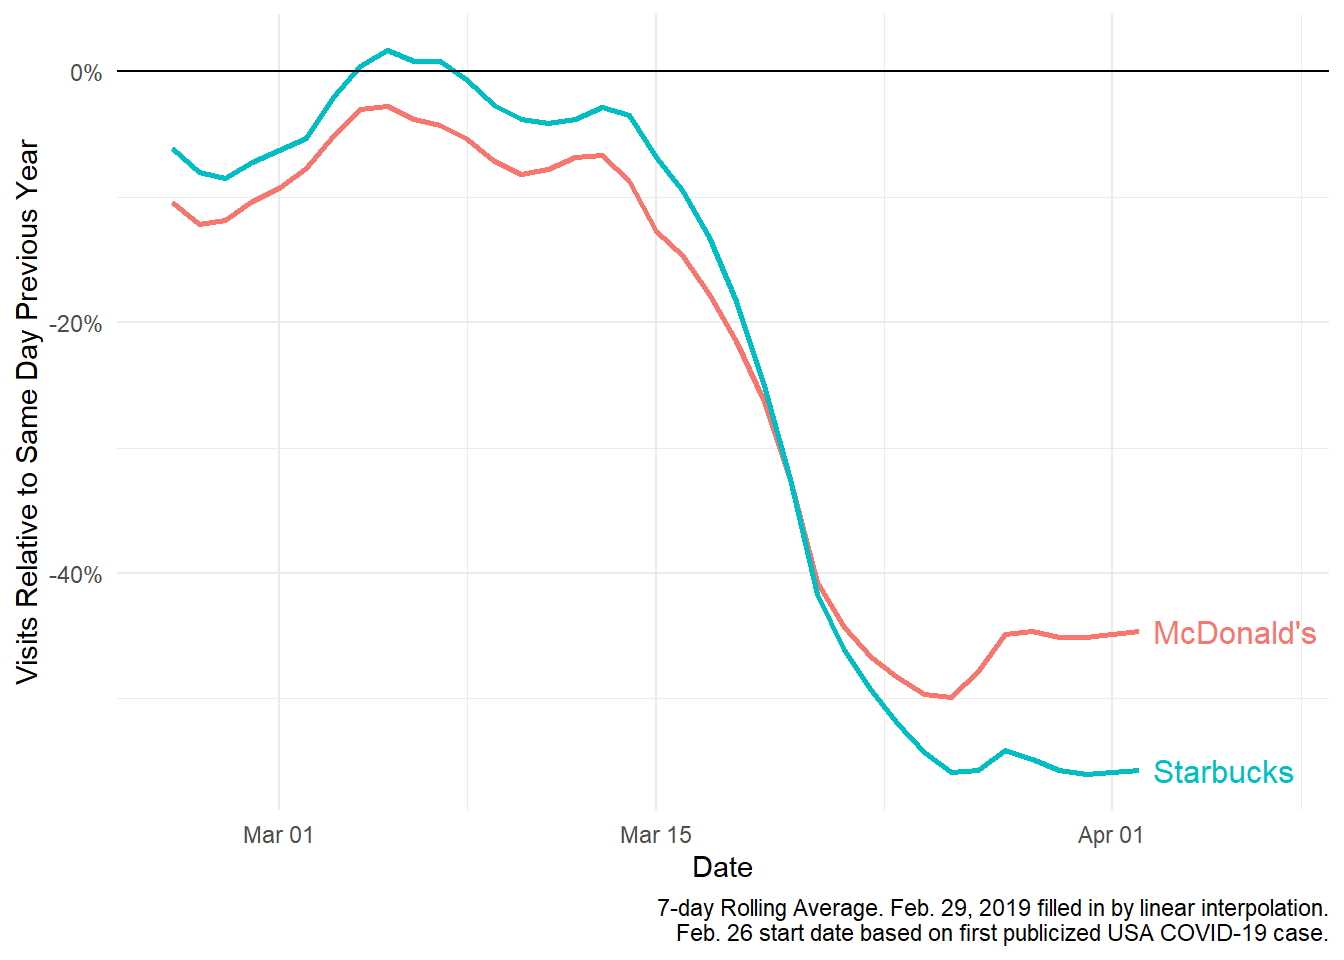
Daily percent change in foot traffic to McDonald’s and Starbucks, relative to the same day in 2019.
This data tells a unique story, one that’s much bigger than COVID-19 alone, especially when you look at y/y foot traffic patterns. While it’s obvious that the arrival of COVID-19 in full force in the U.S. initially caused a panic spike of shopping, at both grocery stores and big box chains alike, it’s important to note that fewer people were visiting these stores in the first place. Whether this is directly related to COVID-19 or more broadly a tell-tale sign of consumers putting convenience first by purchasing online and having goods delivered, there are a lot of dynamics at play right now that could become further accentuated in the weeks and months ahead—and likely even after we overcome the COVID-19 crisis.
This unprecedented period of strict social distancing measures and isolation is changing consumer habits in a big way. It’s only a matter of time to see how many of these new habits stick around once life goes back to “normal” (whatever that may be).
Academic researchers, non-profits, and government organizations: We are donating SafeGraph data for free to help you develop new strategies and solutions in the fight against COVID-19.
We’re already working with hundreds of academic researchers in <strong>SafeGraph’s COVID-19 Data Consortium</strong>. If you do research on behalf of the public good—or if you’re already a participant in our COVID-19 Tactical Response Slack group—please contact fill out this form or contact us at <strong>academics@safegraph.com</strong> to get free access to SafeGraph data today.
If you are with a for-profit business, please <strong>contact our team</strong> today to learn how these datasets can help your business navigate this unfolding health and economic crisis. We want to help you get the data you need to drive positive change in the face of this global pandemic, and working flexibly.
To learn more about the data behind this article and what SafeGraph has to offer, visit https://www.safegraph.com/.


Sign up to receive our stories in your inbox.
Data is changing the speed of business. Investors, Corporations, and Governments are buying new, differentiated data to gain visibility make better decisions. Don't fall behind. Let us help.


Sign up to receive our stories in your inbox.
Data is changing the speed of business. Investors, Corporations, and Governments are buying new, differentiated data to gain visibility make better decisions. Don't fall behind. Let us help.