

Using foot traffic to key brands as a proxy for return to office trends
As the COVID recovery progresses, our customers are eager to track changes in return to work across the country. This example shows how SafeGraph Patterns data was used to analyze how suburban, city, and downtown regions of Chicago have recovered since the pandemic commenced.
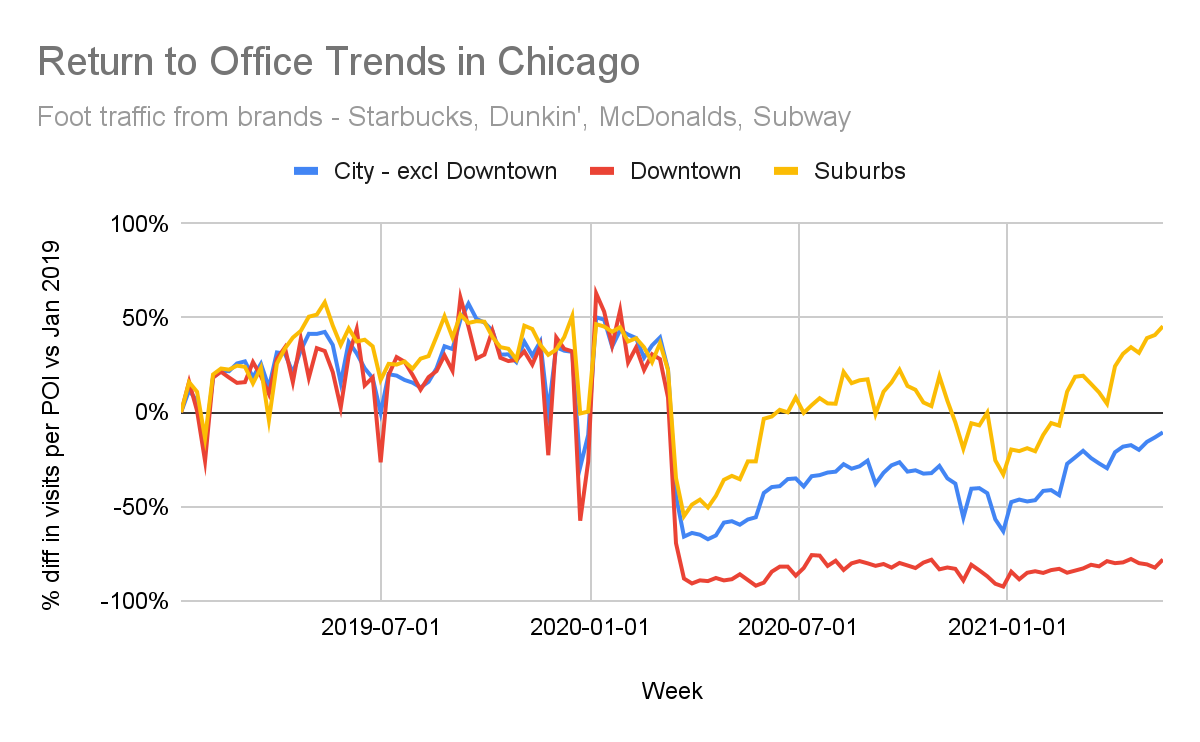
Four major brands, Starbucks, Dunkin’, McDonald’s, and Subway, were selected as proxies for POI that workers would visit as they return to the office. To isolate visits to office related activity, the visit counts were restricted to the morning commute peak of 8am to 9am, Monday through Friday.
The counts were indexed against January 2019 figures to gauge the recovery rate, and the chart below shows significant differences between different regions of Chicago. While foot traffic for POI in the suburbs has returned to pre-pandemic levels, trends in the city and downtown are down 11% and 78%, respectively, as of May 17. The downtown trends may also lag behind as the recovery for tourism and residents moving back to the city take longer to surface.
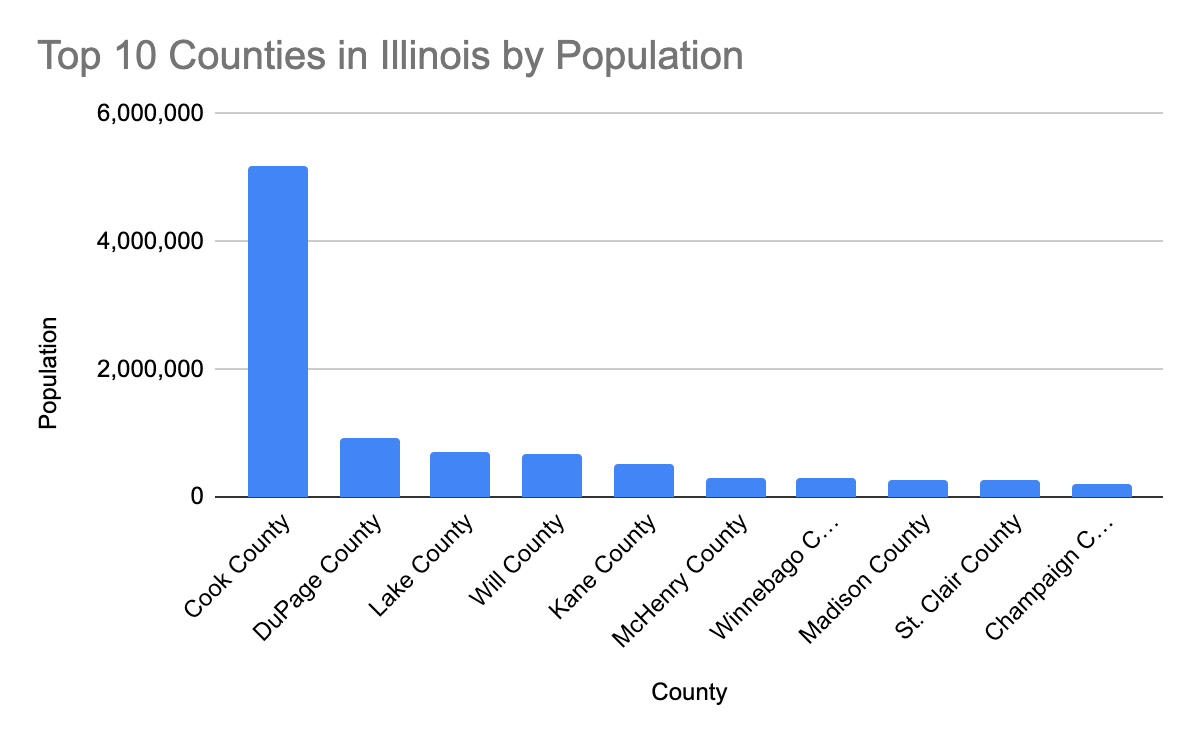
In this analysis we used a combination of county and census block groups (CBGs) to categorize each POI location as suburban, city or downtown. Using county level boundaries alone can be too broad. For example, Cook County accounts for more than 40% of the population in Illinois.
Conversely, CBGs are very detailed geographic units, with over 220,000 CBGs in the US, each representing approximately 600-3,000 people. Our Patterns data includes a column for each POI’s CBG, which allows us to narrow down our findings to more specific regions.
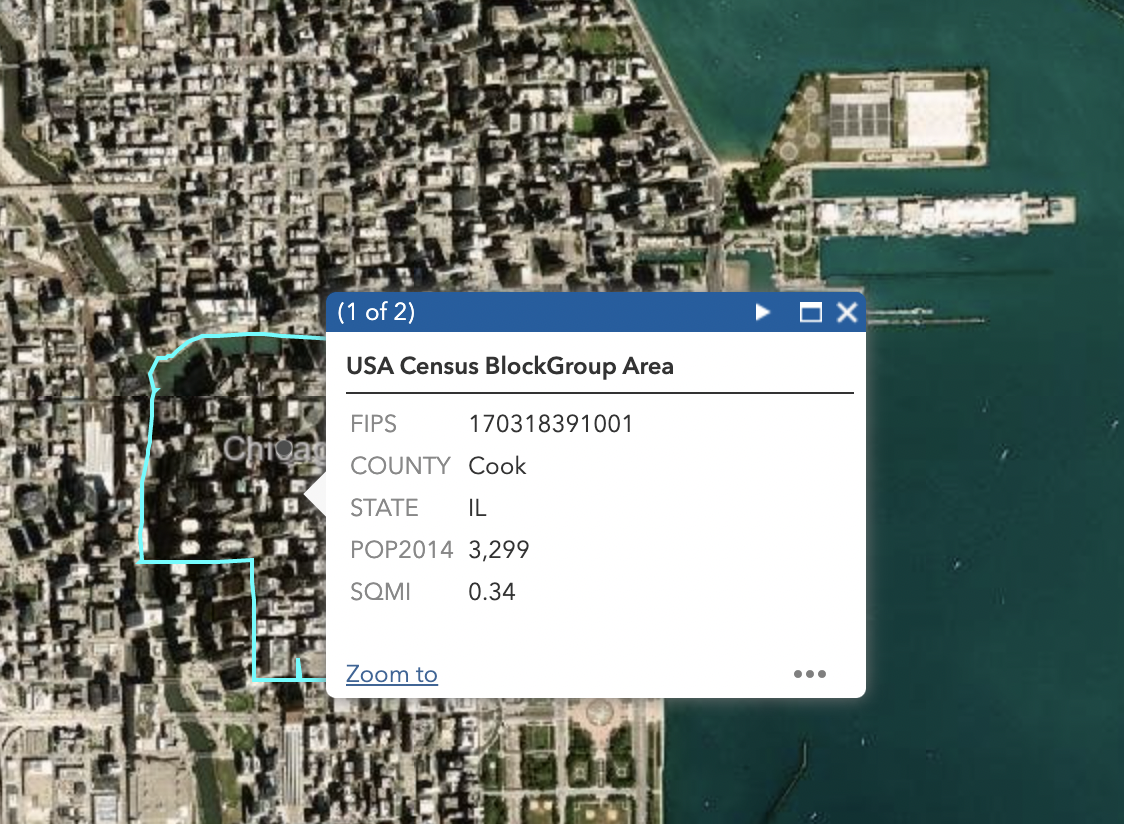
We used the CBG lookup tool to select key areas in downtown Chicago and selected CBGs in the counties neighboring Cook County to represent suburban areas. Similar analysis could be performed with a wider selection of CBGs or different cities altogether.
Additional data we explored included analyzing home CBG for visitors and visitor distance from home data to account for changes in where people were visiting from. The analysis can also be expanded to include other brands, such as CVS or Walgreens.
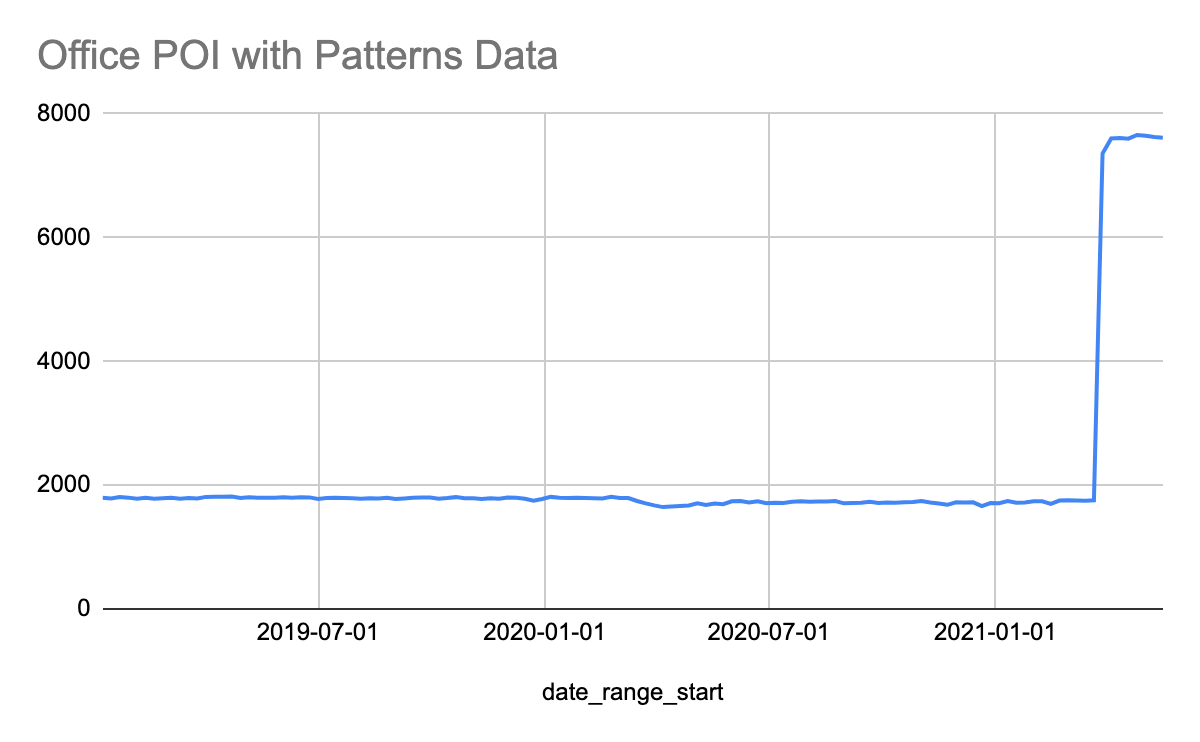
Going forward, we could analyze the change in foot traffic for specific office POI. In the April 2021 release, over 7,000 office POI were added to our Places product, covering over 380 of the Fortune 500 companies. After the next “backfill” in July, when we re-state the entire history of Patterns using the most recent version of Places, we can analyze retrospective visit counts for these POI, as well as historical Canadian Weekly Patterns, which launched in May 2021.
To learn more about the data behind this article and what SafeGraph has to offer, visit https://www.safegraph.com/.


Sign up to receive our stories in your inbox.
Data is changing the speed of business. Investors, Corporations, and Governments are buying new, differentiated data to gain visibility make better decisions. Don't fall behind. Let us help.


Sign up to receive our stories in your inbox.
Data is changing the speed of business. Investors, Corporations, and Governments are buying new, differentiated data to gain visibility make better decisions. Don't fall behind. Let us help.