
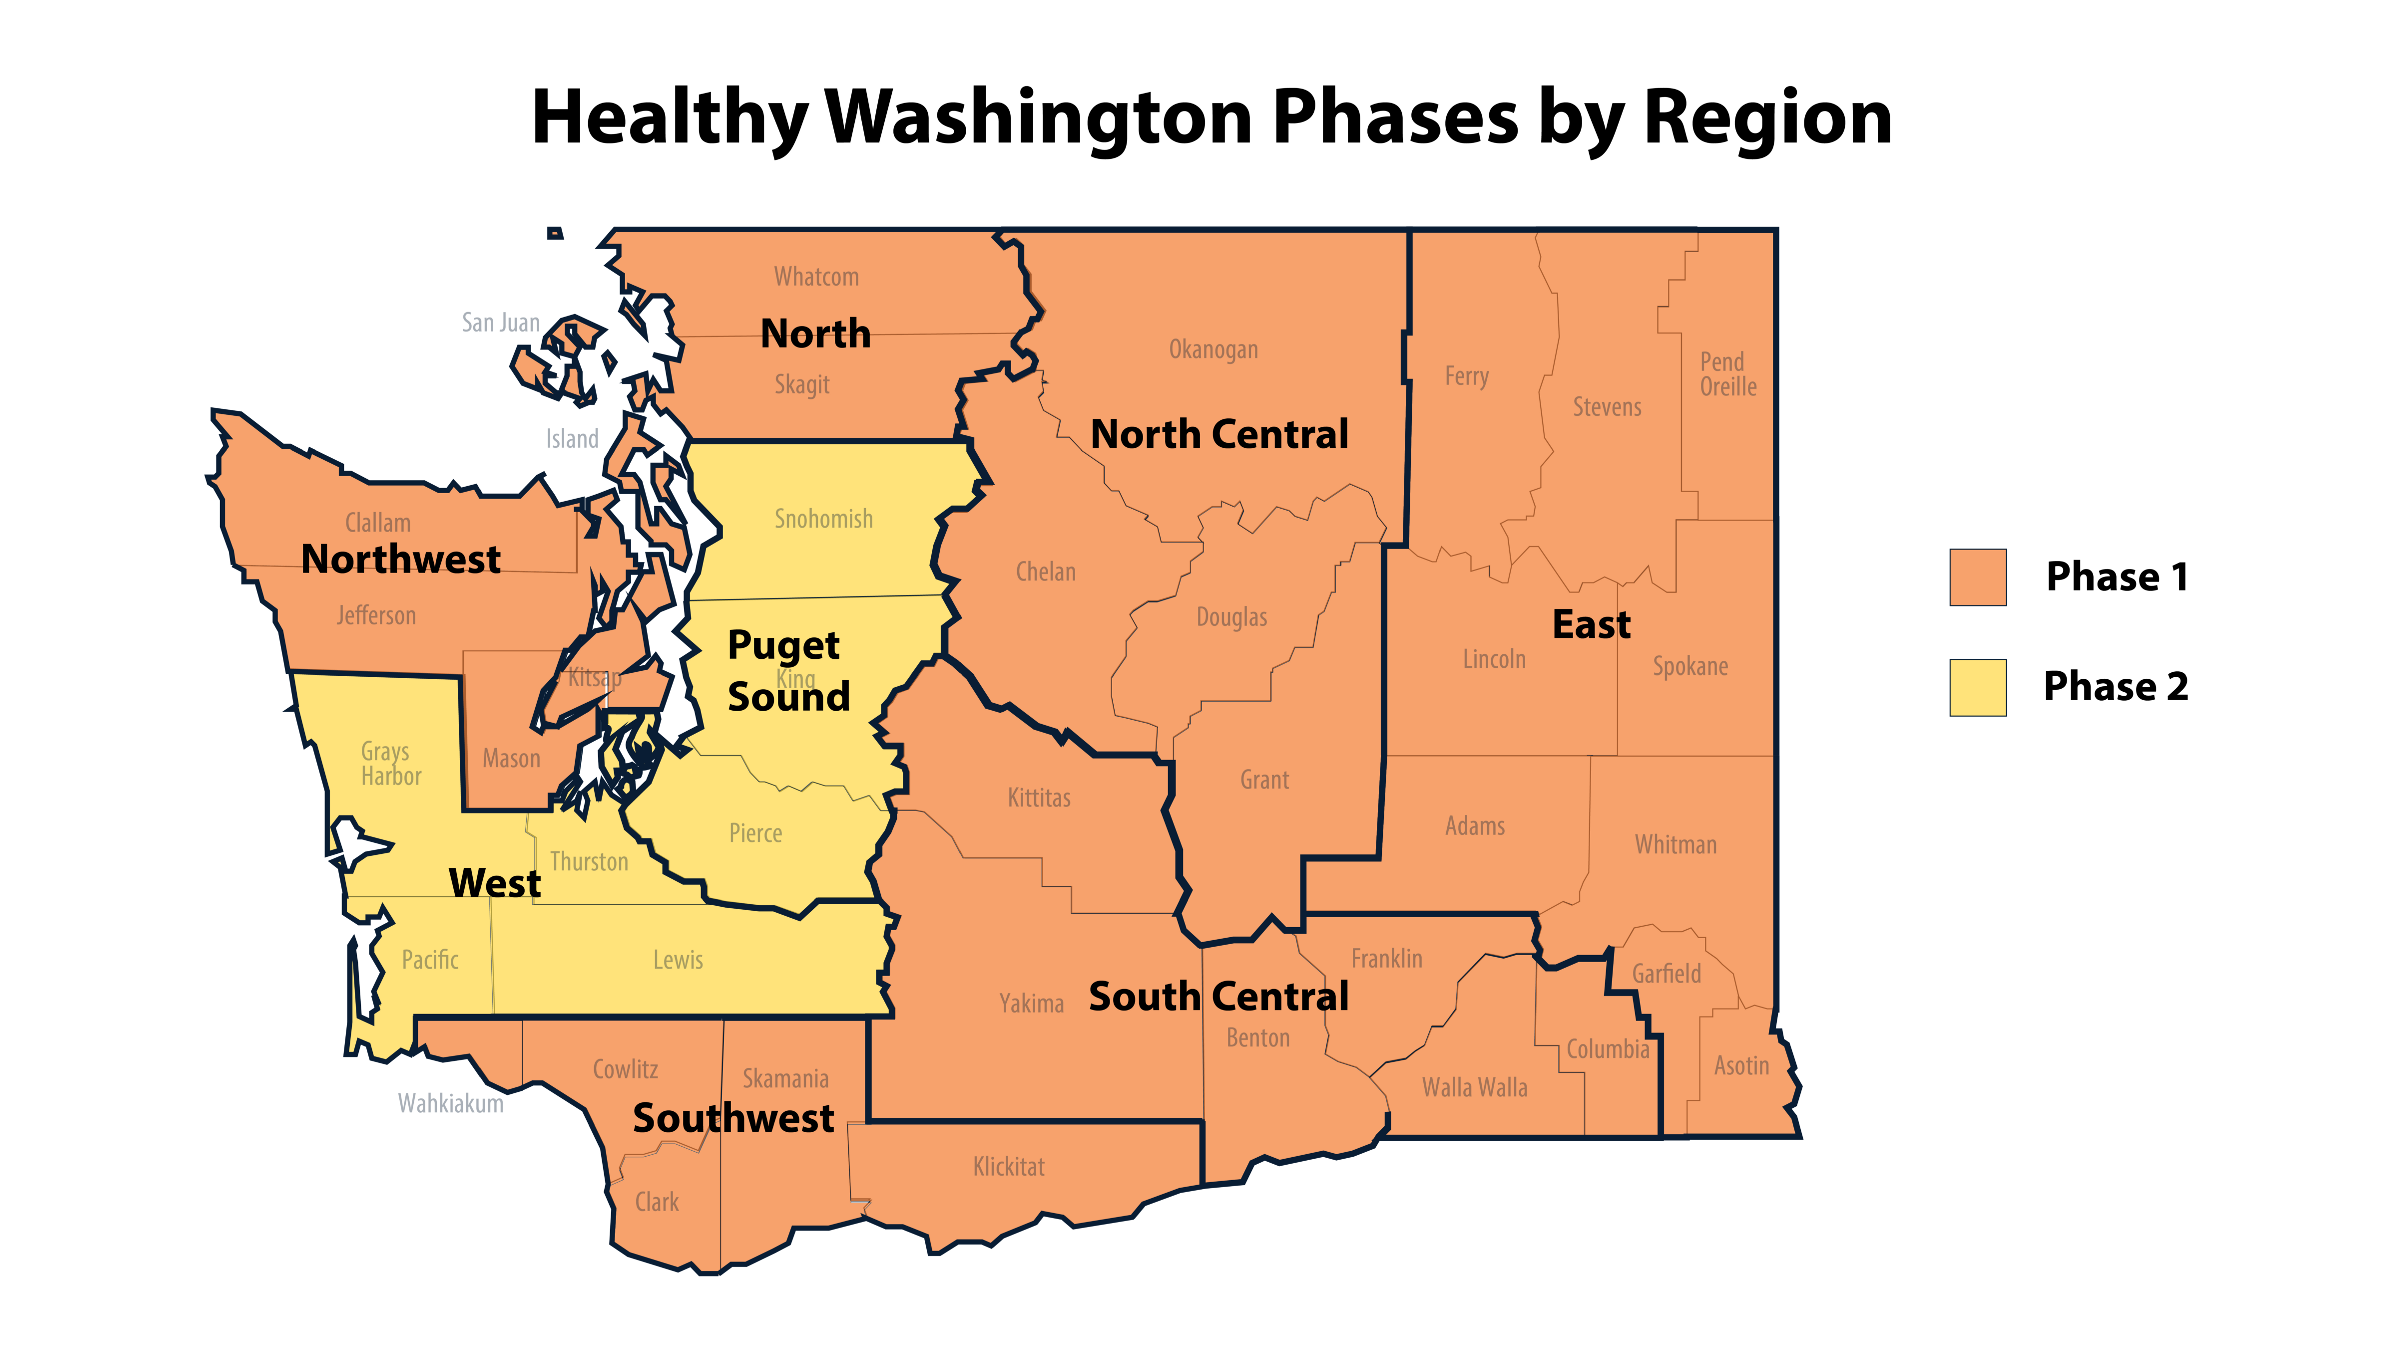
How strictly have businesses been adhering to COVID restrictions? We’ll be taking a look at Washington State, which has a COVID reopening plan that staggers reopening phases by county. Why is this handy? Because we can look at the “reopening phase” changing in some counties but not others. This gives us a baseline of behavior in places where the rules aren’t changing, so we can see if people actually change their behavior when the rules change.
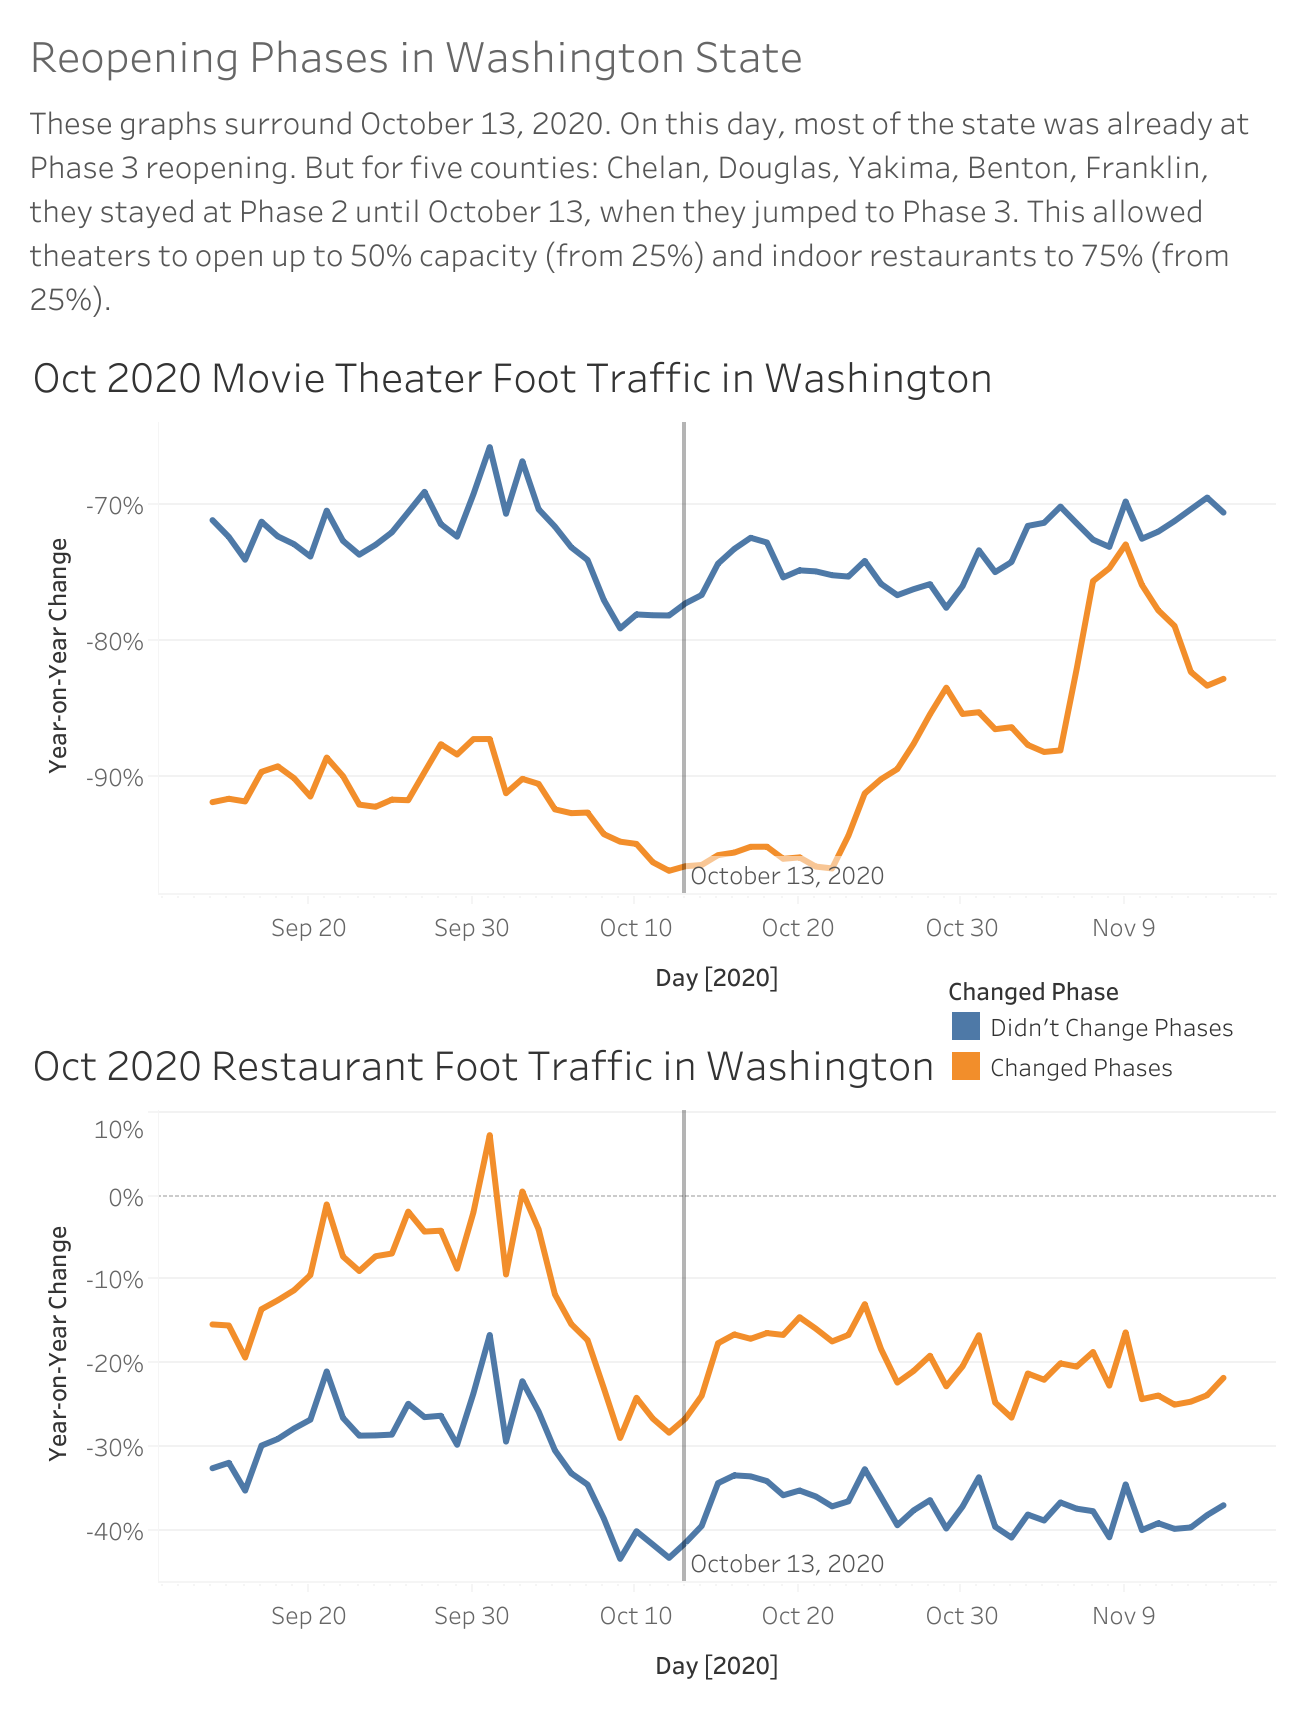
In early October 2020, most of the state was in “Phase 3” reopening, which allowed for 50% capacity in places like movie theaters, but several counties were in Phase 2, which allowed for only 25% capacity. Then on October 13, all the remaining counties went to Phase 3 as well. Can we see the effect in the foot traffic data?
This first set of graphs looks at the October 13, 2020 change. We can see the “Didn’t Change Phases” counties that were at Phase 3 for the duration of the graph, and the “Changed Phases” counties, which moved from Phase 2 to Phase 3 on October 13.
By January 2020, everyone was back down to Phase 1. However, in February things started opening up again. On February 1, 2021, some of the biggest counties in the state progressed to Phase 1. Then, on February 14, everyone else joined them, putting the state together on Phase 2.
The year-on-year comparison of 2019 foot traffic to 2020 makes things look pretty compliant, at least for movie theaters. The movie theaters in Phase 3 counties are down 70% from the previous year. We could interpret this as being compliant with the 50% capacity requirement, although “capacity decline” and “decline in foot traffic from 2019 to 2020” are only the same thing if theaters are always at their legal capacity, which isn’t the case. Still, we see declines that at least look consistent with the 50% capacity change.
Phase 2 counties have much bigger drops for theaters, consistent with only having 25% allowable capacity. Then, about a week after they shift to Phase 3, we see the ex-Phase-2 counties shift up pretty quickly. Looks like they’re joining the old-Phase-3 counties. The phases matter!
Restaurants are a bit different. Year-on-year declines are not nearly as large as capacity changes would suggest. However, keep in mind that anyone coming to pick up food (including delivery drivers) would count as being present, as would outdoor eating in many locations. It might also be easier to go just a bit past legal capacity in a restaurant - who knows?
But more important is that we don’t see any real effect of the phase change on October 13. In fact, the counties that change and the counties that don’t are in more or less lockstep the entire time. They’re so similar we had to double-check we didn’t make a mistake calculating them. Nothing changes when the phases do, telling us restaurants weren’t that responsive to changes in the reopening phases.
Restaurants see a similar trend when we move to the February changes.
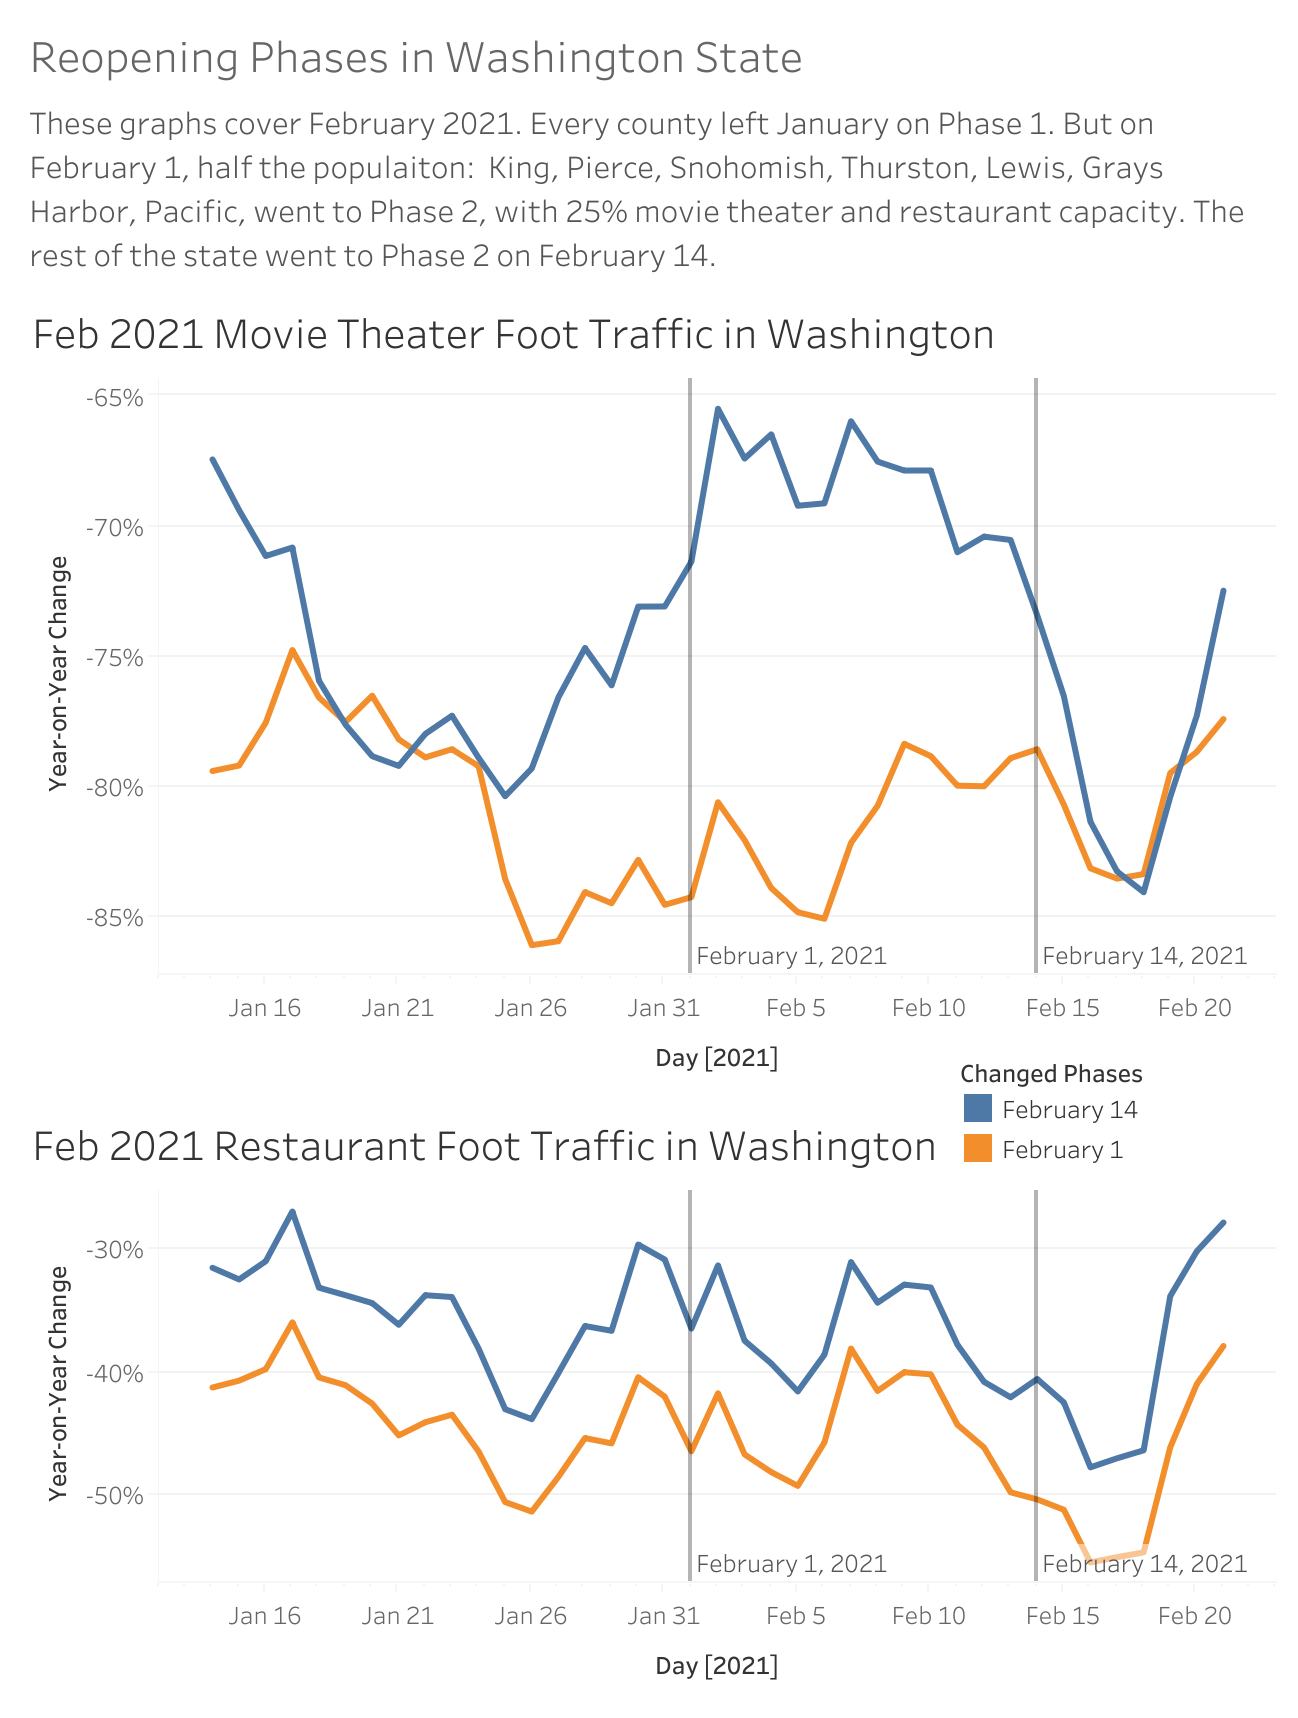
Again, the trend for restaurants is almost identical between the counties that changed from Phase 1 to Phase 2 on February 1 and on February 14. Year-on-year figures are lower than they were in October, overall, with differences of -30% to -50% compared to February 2020. But the February 1 group doesn’t seem to respond at all to February 1. The same goes for the February 14 group.
For movie theaters, we see almost the opposite of what we’d expect. The group that moves to Phase 2 on February 1 seems to respond to the increased capacity by having less foot traffic at movie theaters, while the group that won’t go to Phase 2 for a few weeks sees more. Further, when those places do go to Phase 2, that’s the exact time foot traffic levels come back down. In fact, the graph looks almost exactly as we’d expect it to if the counties had been swapped.
That said, these numbers are still quite large year-on-year declines. They may still represent businesses obeying capacity requirements, even if their behavior doesn’t loosen up once the requirements do.
What does this mean? Businesses (or customers) may be a bit less responsive to official phase changes in February than they were in October. Or maybe the change from Phase 2 to 3 is a bigger deal than from 1 to 2. Or perhaps, given their October-February experience of reopening a bit only to be shut down again, they may be waiting for a fuller reopening before bothering to change their procedures.
To learn more about the data behind this article and what SafeGraph has to offer, visit https://www.safegraph.com/.


Sign up to receive our stories in your inbox.
Data is changing the speed of business. Investors, Corporations, and Governments are buying new, differentiated data to gain visibility make better decisions. Don't fall behind. Let us help.


Sign up to receive our stories in your inbox.
Data is changing the speed of business. Investors, Corporations, and Governments are buying new, differentiated data to gain visibility make better decisions. Don't fall behind. Let us help.