
While there are clear benefits to diving deep into the specific performances of key brands, there is also a value in stepping back to look at the retail space from a wider perspective.
So, how has the recovery unfolded as 2020 comes to a close? We dug into industry analysis insights to see.
Wider Status Update
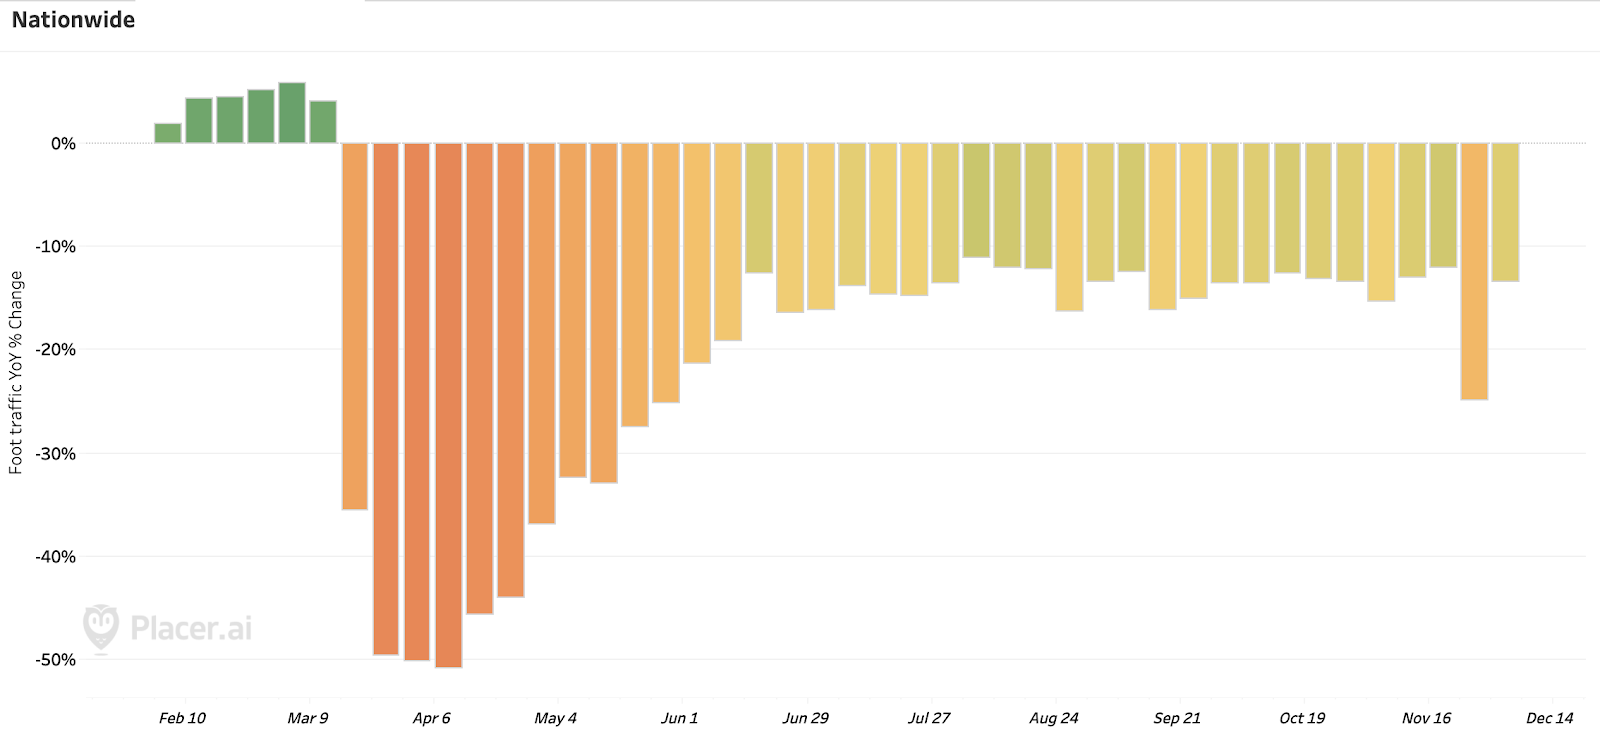
Since mid-June, the wider retail sector has seen visits down between 11% and 15% overall. And while this number seems relatively strong, it is buoyed by the better performances of sectors like home improvement and grocery. Another key takeaway is that the wider retail landscape was seeing steady improvements heading into the heart of the holiday season, prior to the resurgence of COVID cases in November.
And this had a huge effect. The week of November 23rd, which included Thanksgiving and Black Friday weekend, saw visits down 25% for the overall retail sector. This was a particularly difficult weekend as it represented a step back following several weeks of improvement heading into this key retail weekend. Obviously, its cause was very likely rooted in a resurgence of COVID cases throughout the country. Nonetheless, the timing was exceptionally problematic, limiting what was otherwise a steady trend of recovery.
The Regional Perspective
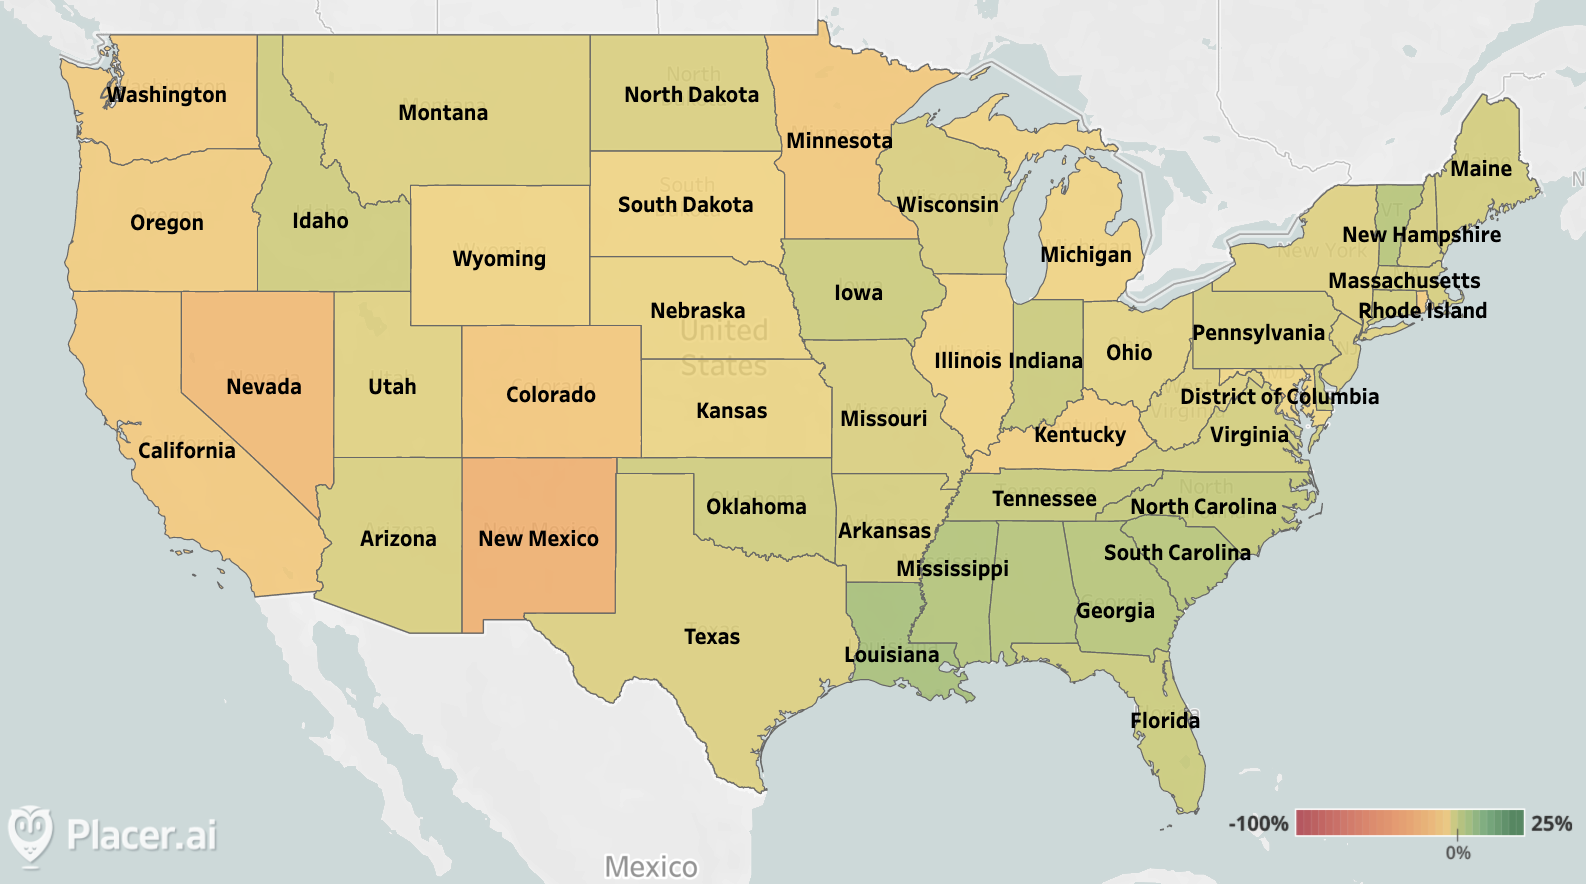
But, as often seen throughout the pandemic, the effects have not been uniform across the country. For Louisiana, overall retail visits were down just 2.5% year over year the week beginning November 30th. Yet, in California, a key state where many retailers see their largest number of locations, visits were down 20.0% year over year the same week. Other significant retail states like Texas, New York and Florida saw overall retail visits down 12.5%, 12.9% and 10.0% respectively year over year that week.
Sector Positioning
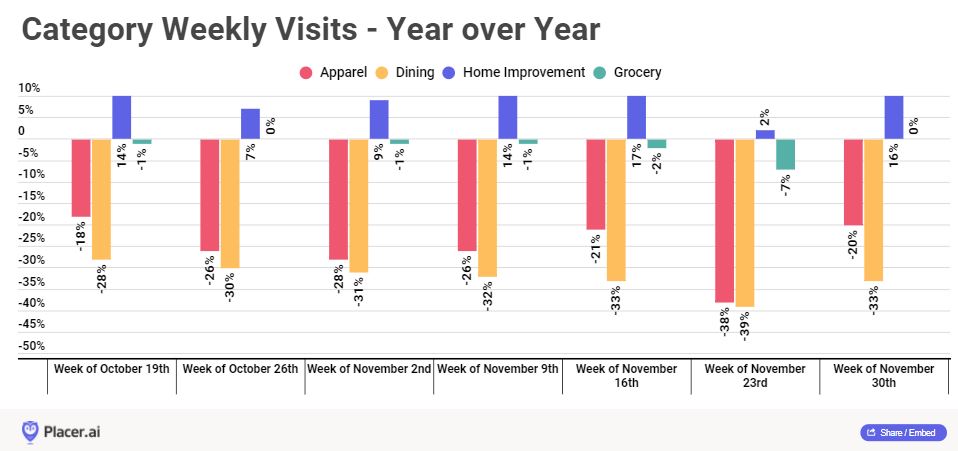
Another area where a lack of ‘uniformity’ has been even more significant is when analyzing different retail sub sectors. Looking at weekly visits from the week of October 19th through the week beginning November 30th shows stark differences. While weekly visits to the wider apparel sector were down an average of 25% during that period, the dining sector saw an average visit decline of 32%. On the other hand, the grocery space overall, including hard hit brands like Whole Foods, saw an overall average decline of just 2% during that time frame while the home improvement sector saw an average year over year increase of 11%.
Why this perspective matters
A more widespread perspective on the retail landscape can accomplish several critical factors. Firstly, it allows us to establish a benchmark for which specific brands across specific sectors can be compared to. Secondly, it gives us a better sense of the overall effect, including the obvious takeaway that in the grand scheme of things, offline retail is still very much a fundamental piece of the puzzle. Essentially, offline retail faced the worst possible combination of events and it still saw massive visit numbers.
Finally, it enables us to clearly differentiate between the unique challenges facing different brands based on the region or sector they operate within. And this is very valuable. It’s easy to sometimes ignore the fact that while certain brands ‘compete’ they have very different regional distributions. Recognizing factors like this can help contextualize performance, providing valuable indicators about who could bounce back fastest.
To learn more about the data behind this article and what Placer has to offer, visit https://www.placer.ai/.


Sign up to receive our stories in your inbox.
Data is changing the speed of business. Investors, Corporations, and Governments are buying new, differentiated data to gain visibility make better decisions. Don't fall behind. Let us help.


Sign up to receive our stories in your inbox.
Data is changing the speed of business. Investors, Corporations, and Governments are buying new, differentiated data to gain visibility make better decisions. Don't fall behind. Let us help.