
OVERVIEW
Digital Heat is an easy-to-use heatmap to help you quickly identify at scale which industries and companies are most impacted by the current economic environment. The report tracks in near real-time year-over-year (YoY) weekly website traffic trends.
On a macro level, it highlights directional trends – industries that are poised to benefit, and those that remain vulnerable. On a micro level, this monitor can help isolate differences within an industry.
This report helps analysts, traders, portfolio managers, and chief investment officers with idea generation and risk management.
KEY CHANGES THIS WEEK
CONTENTS
MACRO VIEW
What’s Changed?
SimilarWeb Sector Heatmap
Weekly Website Visits YoY Heatmap
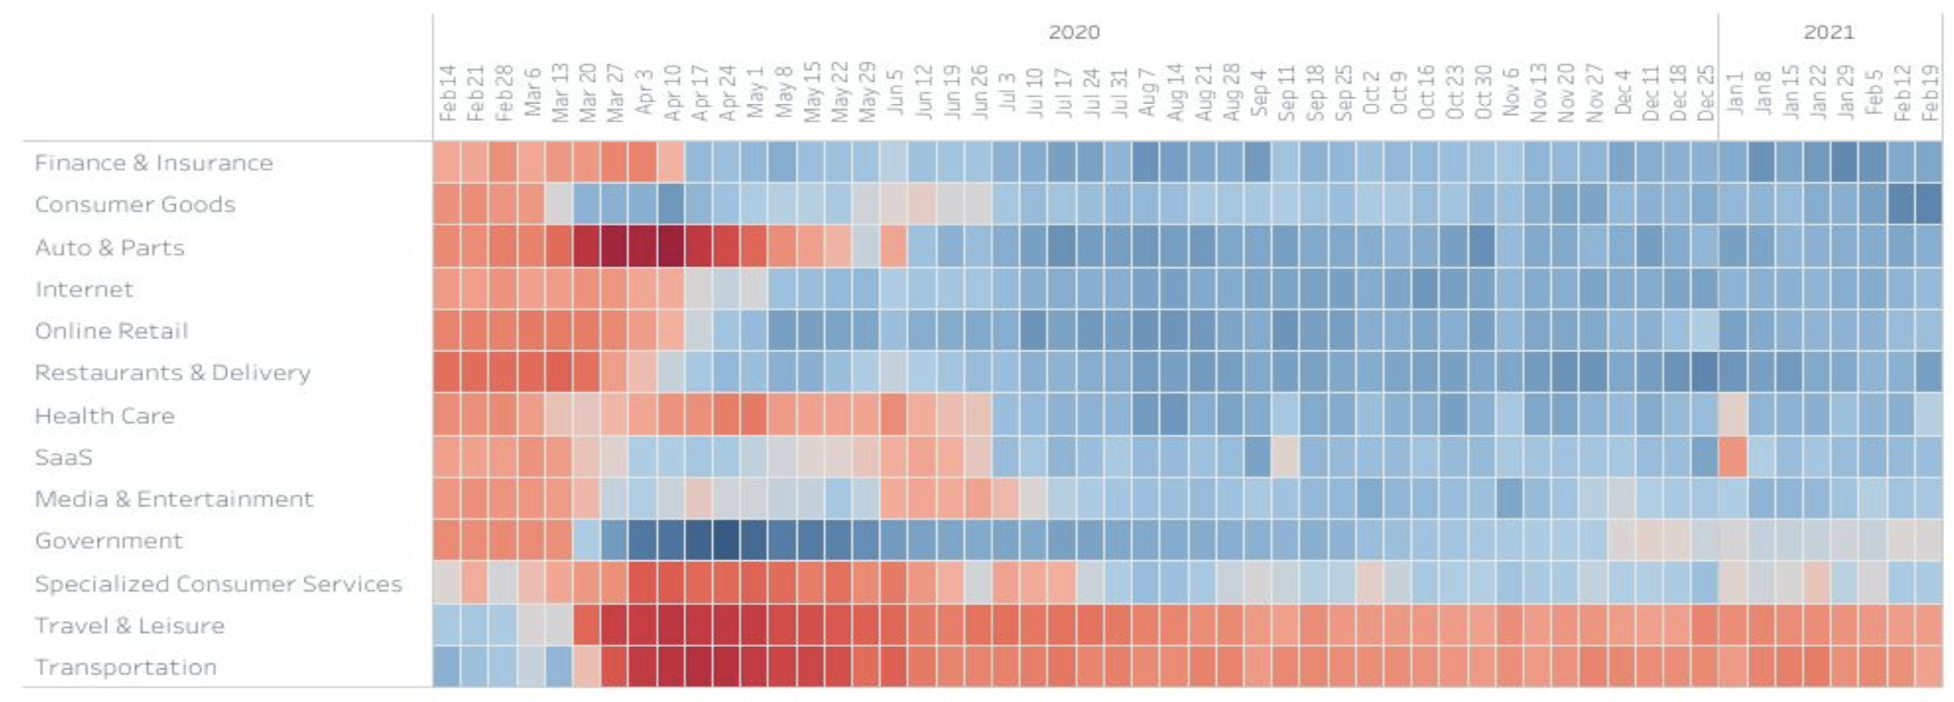
A blue box represents above average growth in visits to sites (or a group of sites), A red box represents above average decline.
MICRO VIEW
What’s Driving the Change?
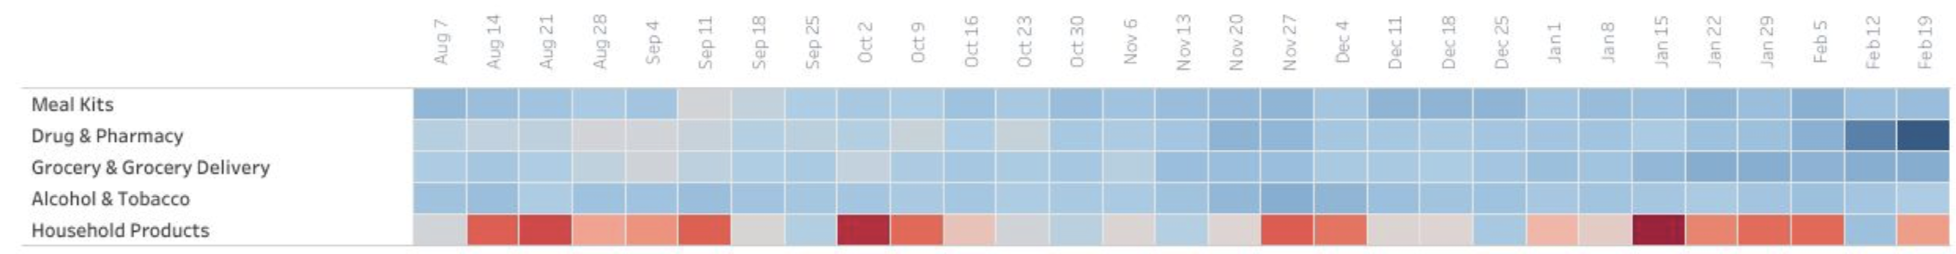
Consumer Goods
Weekly Website Visits YoY Heatmap
This sector is one of the strongest in terms of YoY traffic growth. The primary driver: powerful growth from drug & pharmacy sites in the last two weeks. Grocery & grocery sites have also experienced increased site visits.
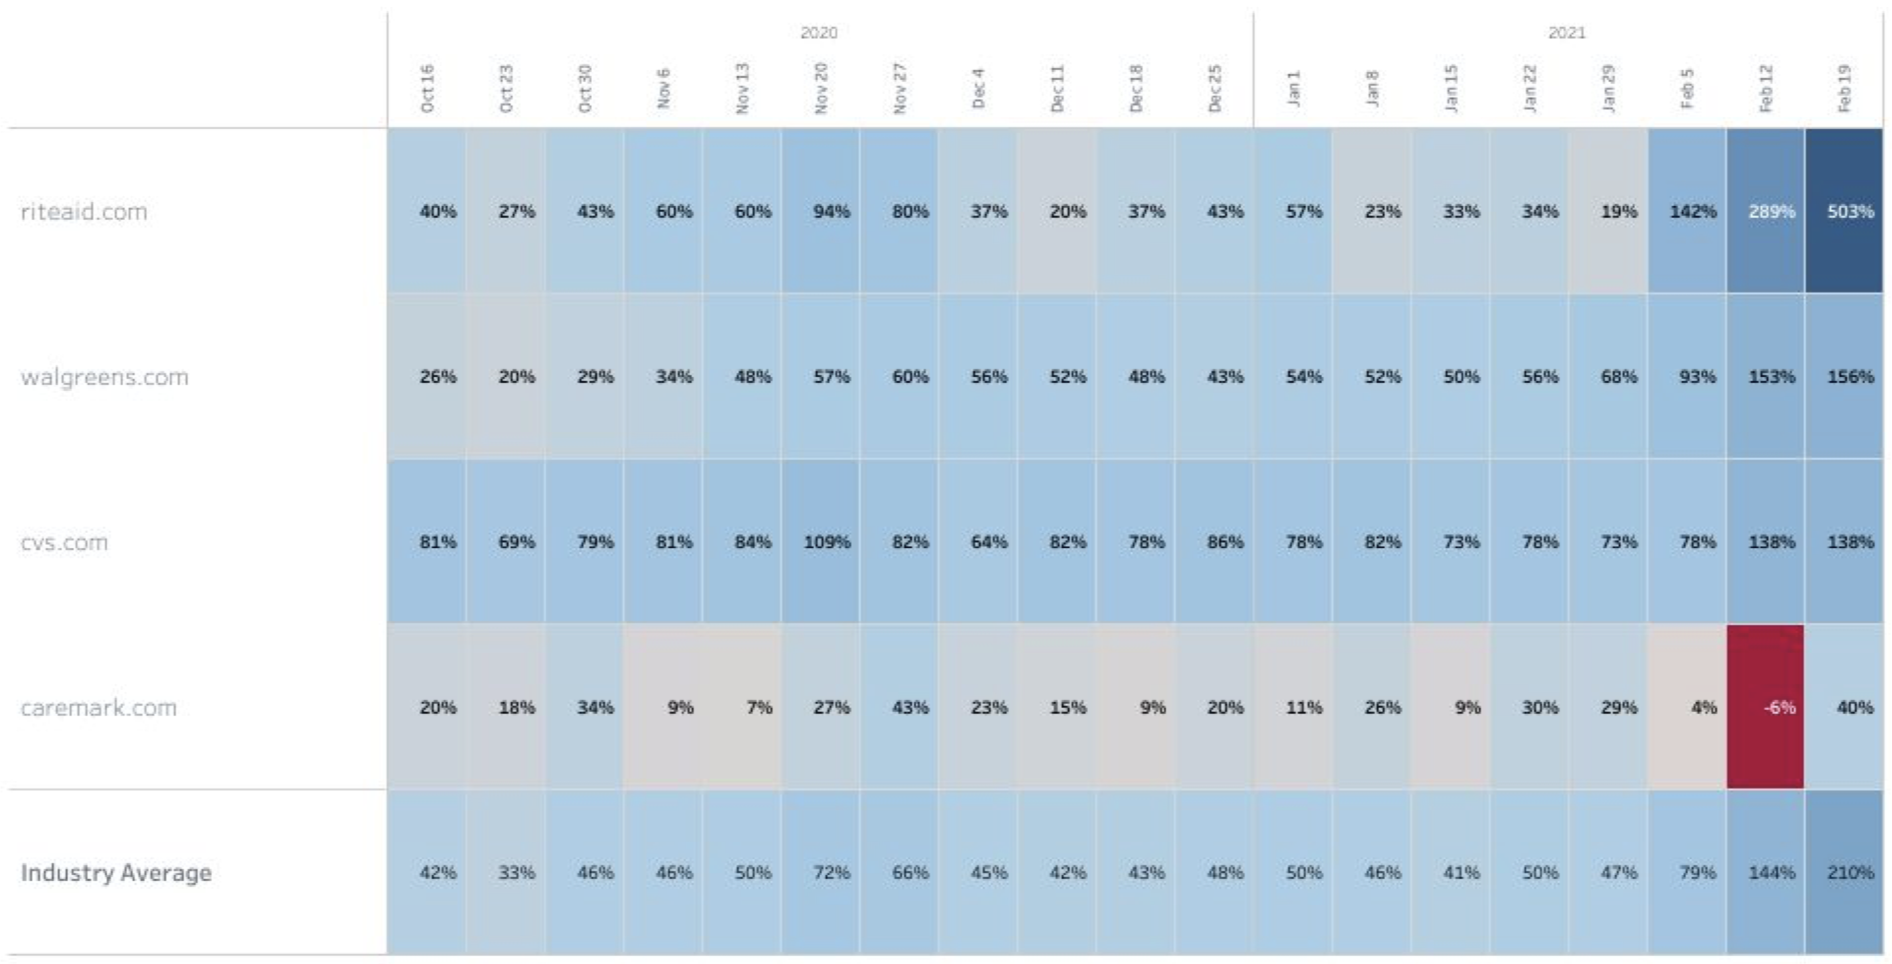
Consumer Goods | Drug & Pharmacy
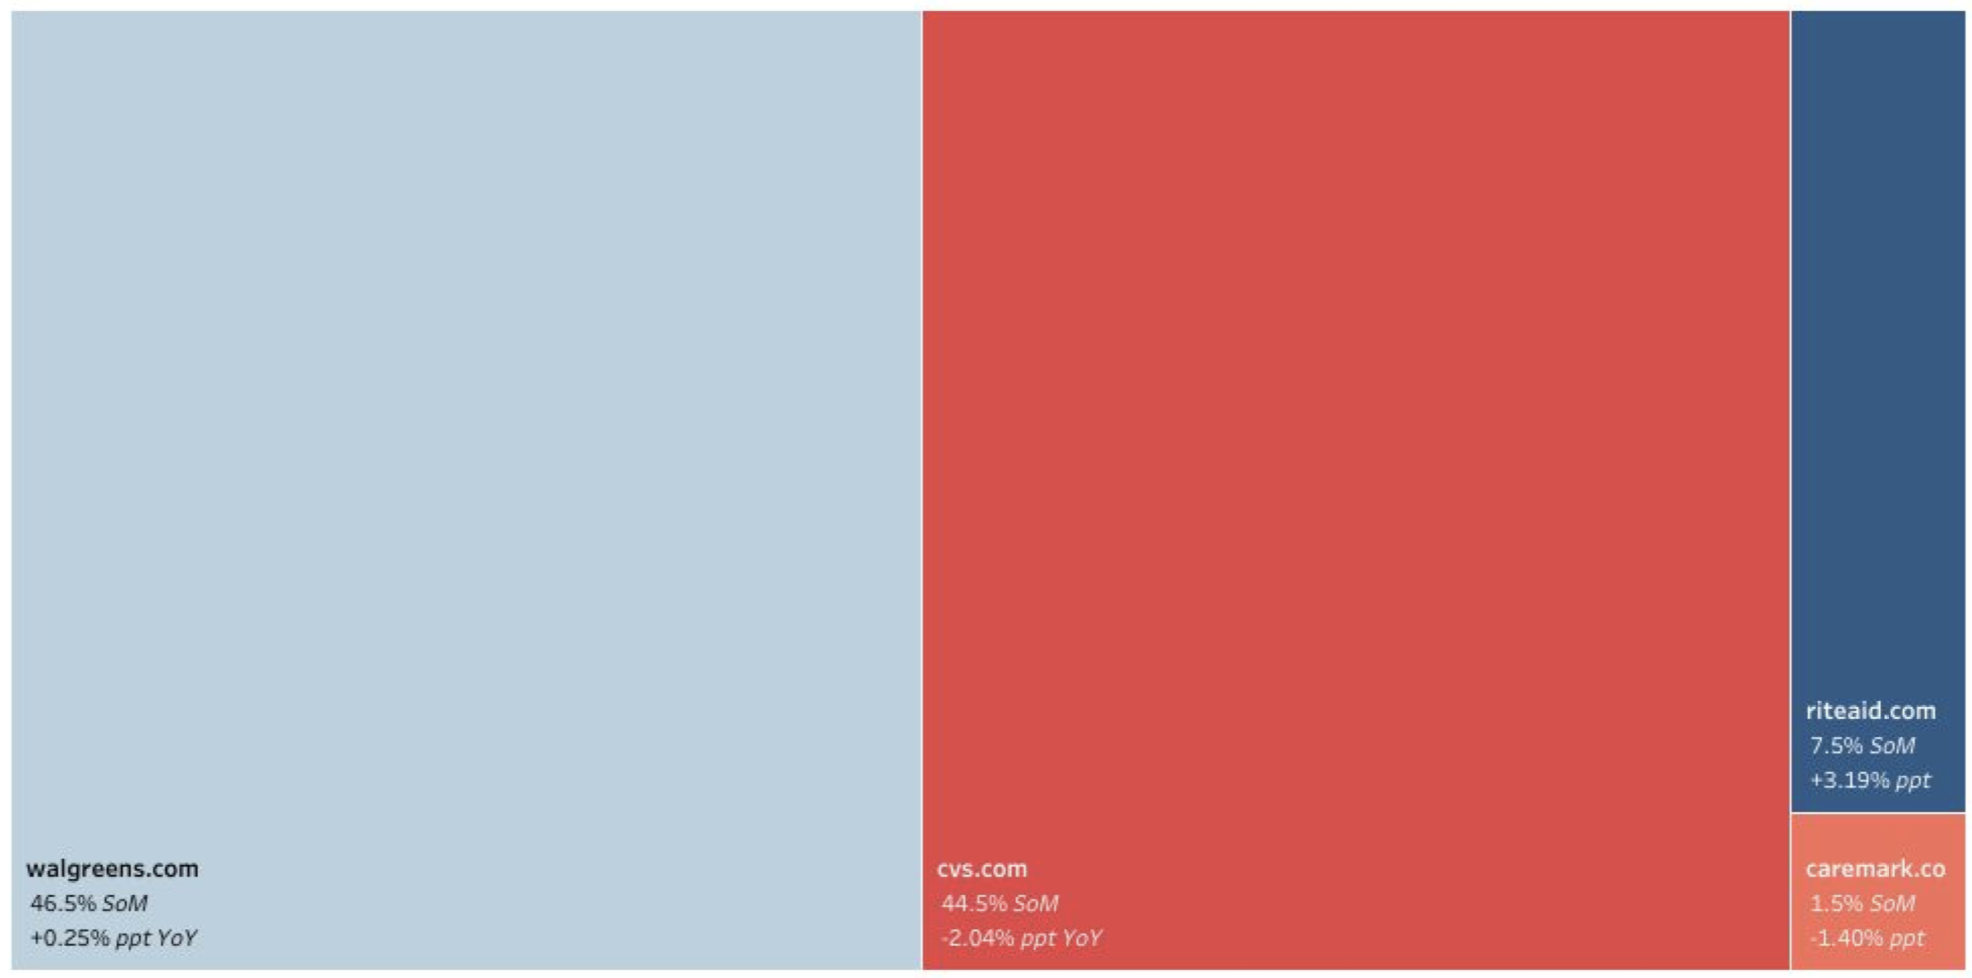
Weekly Website Visits YoY Heatmap & Market Share Treemap
Average traffic growth for this industry was >200% YoY in the week ending Feb. 19, likely due to the availability of the COVID-19 vaccine and online booking facilities at most of the pharmacies we track. The most impressive growth was seen by riteaid.com, that reached >500% YoY in the week ending Feb. 19. Rite aid has also grown its SoM by 3.19 percentage points (ppt) to 7.5%. Despite the strong growth, riteaid.com’s SoM is still dwarfed by walgreen.com (46.5%) and cvs.com (44.5%).
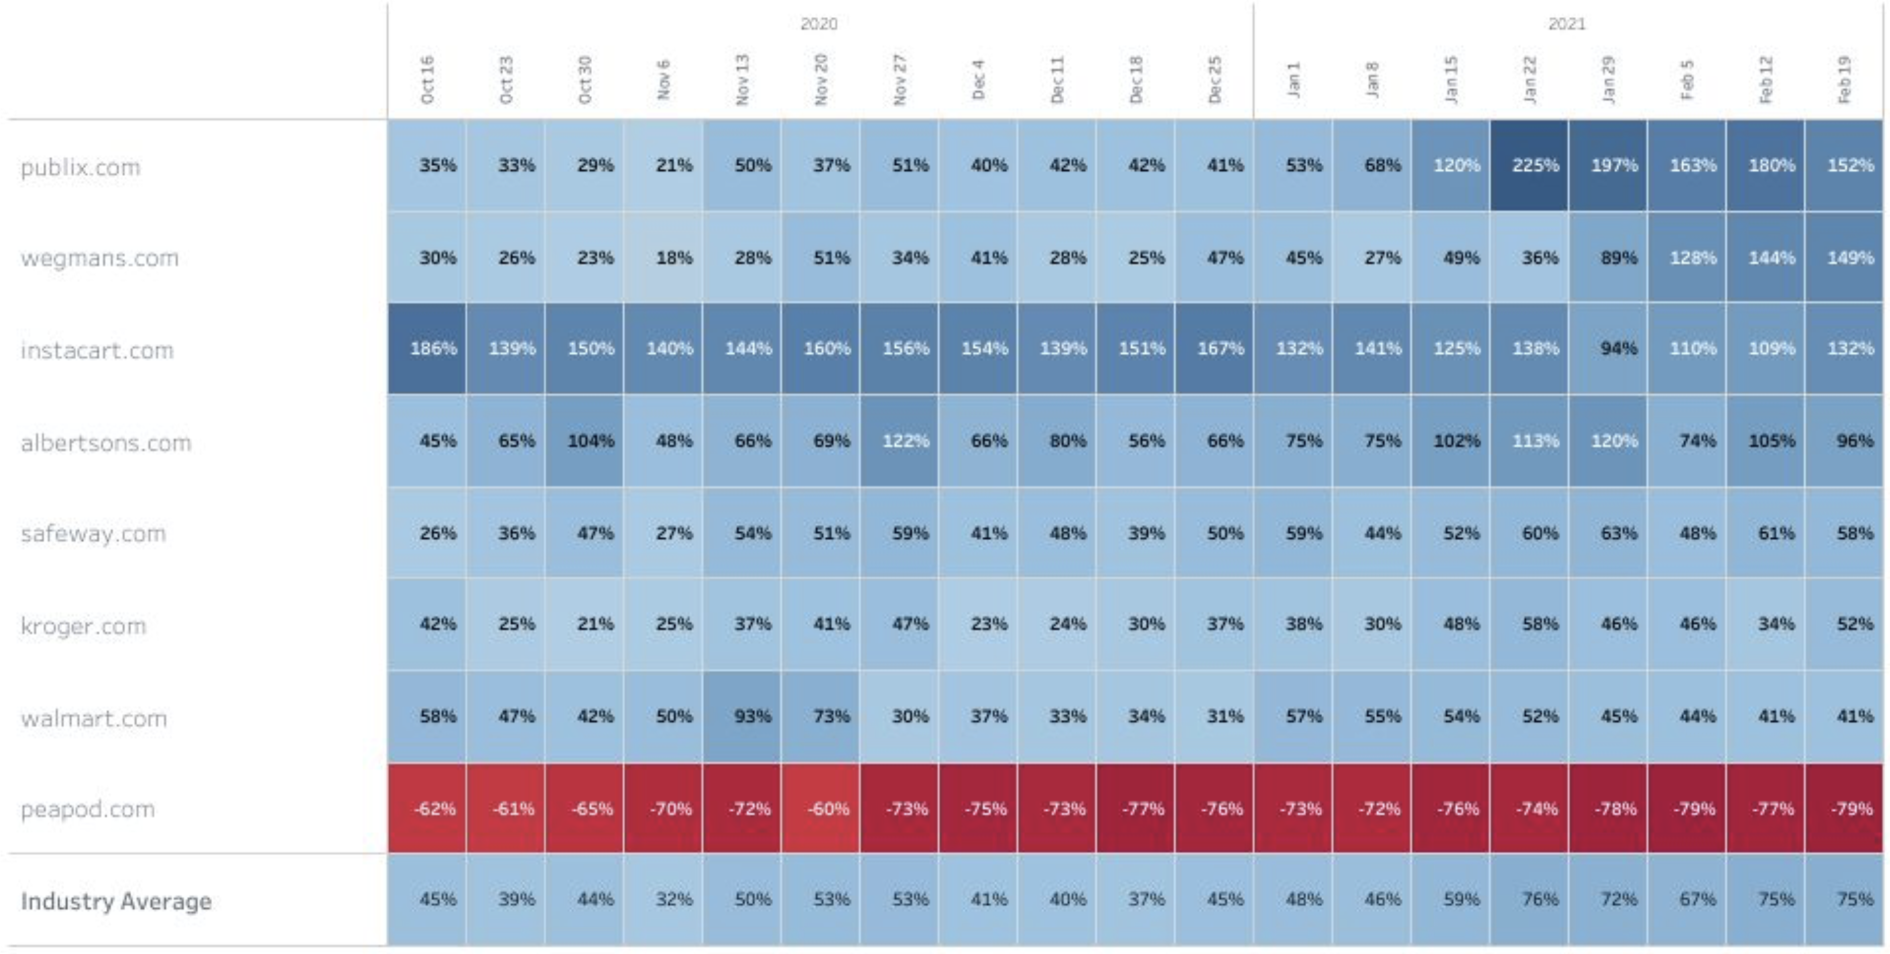
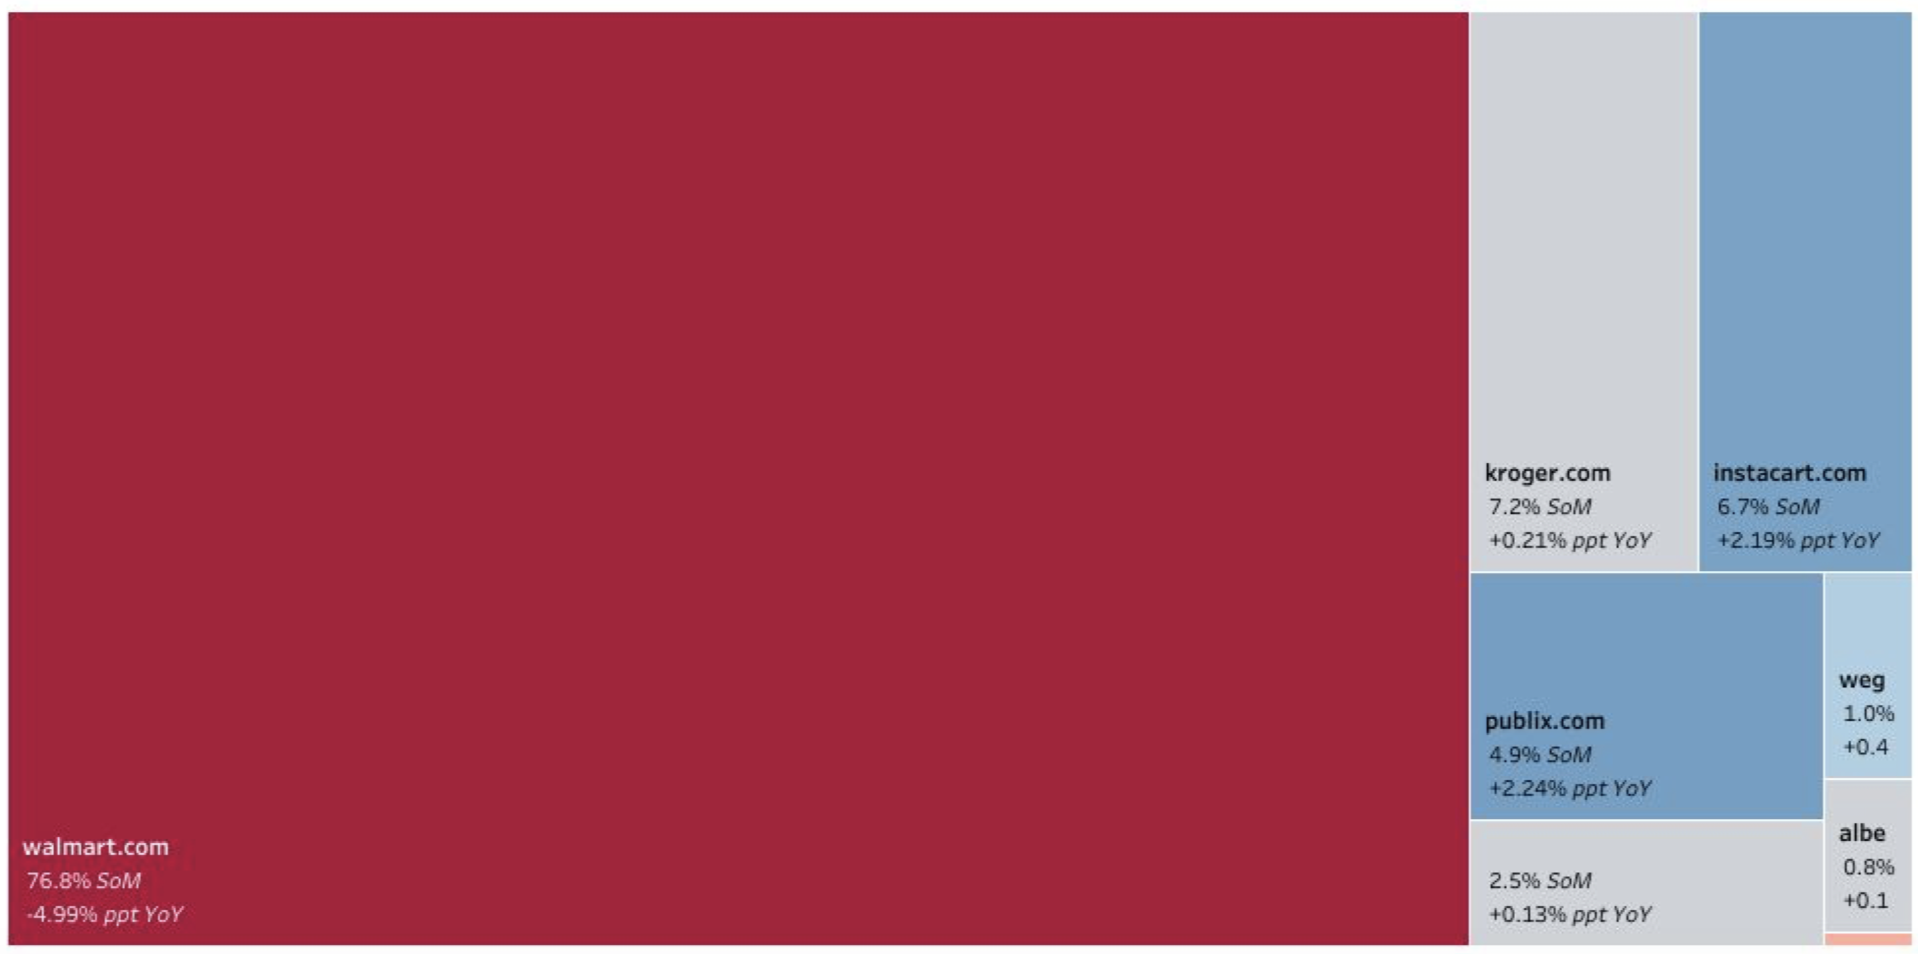
Consumer Goods | Grocery & Grocery Delivery
Weekly Website Visits YoY Heatmap & Market Share Treemap
This industry’s growth is driven by publix.com, wegmans.com, and instacart.com, which have all enjoyed >100% YoY growth in website visits for the past few weeks. Publix.com has been seeing this positive trend since the beginning of January when the supermarket started offering the COVID-19 vaccine – available via online appointment.
The name that really stands out in this industry is instacart.com, that has been enjoying exceptional (>100%) YoY traffic growth since October. Insatcart also increased its SoM by 2.19 ppt to 6.7%. Instacart is one of the most exciting IPOs expected to hit the markets this year. Read more about it here.
While the industry as a whole is doing well, we also note peapod.com, the only player to see YoY traffic growth turn red. Peapod is joined at the bottom of the pack with the great walmart.com, that is seeing below average growth (41%) compared to the rest of the sector (75%). While walmart.com continues to hold the most significant SoM by far, this is deteriorating.
This report contains a select subset of our digital market offerings.
Appendix - How To Read The Maps
Digital Heat comprises of three distinct maps:
**Cross-Sector & Cross-Industry Heatmaps
**These _heatmaps_ display normalized indices based on statistical factor modeling. These indices summarize the relative performance of either a sector or an industry over time. Blue cells represent an above average growth rate and red cells represent a below average decline.
**Industry Analysis Heatmap
**These heatmaps represent the YoY growth rates of websites within an industry over time. Blue cells represent a high YoY growth rate, and red cells represent a YoY reduction.
**Industry Share Treemap
**These _treemaps_ represent the market share of web traffic visits within an industry. The size of the cell represents the relative visits market share (SoM). The color of each cell represents the YoY shift in market share (YoY ppt) - blue cells depict an increase in share over the course of a year, and red cells depict a loss in share.
To learn more about the data behind this article and what Similarweb has to offer, visit https://www.similarweb.com/.


Sign up to receive our stories in your inbox.
Data is changing the speed of business. Investors, Corporations, and Governments are buying new, differentiated data to gain visibility make better decisions. Don't fall behind. Let us help.


Sign up to receive our stories in your inbox.
Data is changing the speed of business. Investors, Corporations, and Governments are buying new, differentiated data to gain visibility make better decisions. Don't fall behind. Let us help.