
Week Ending 3 April 2021
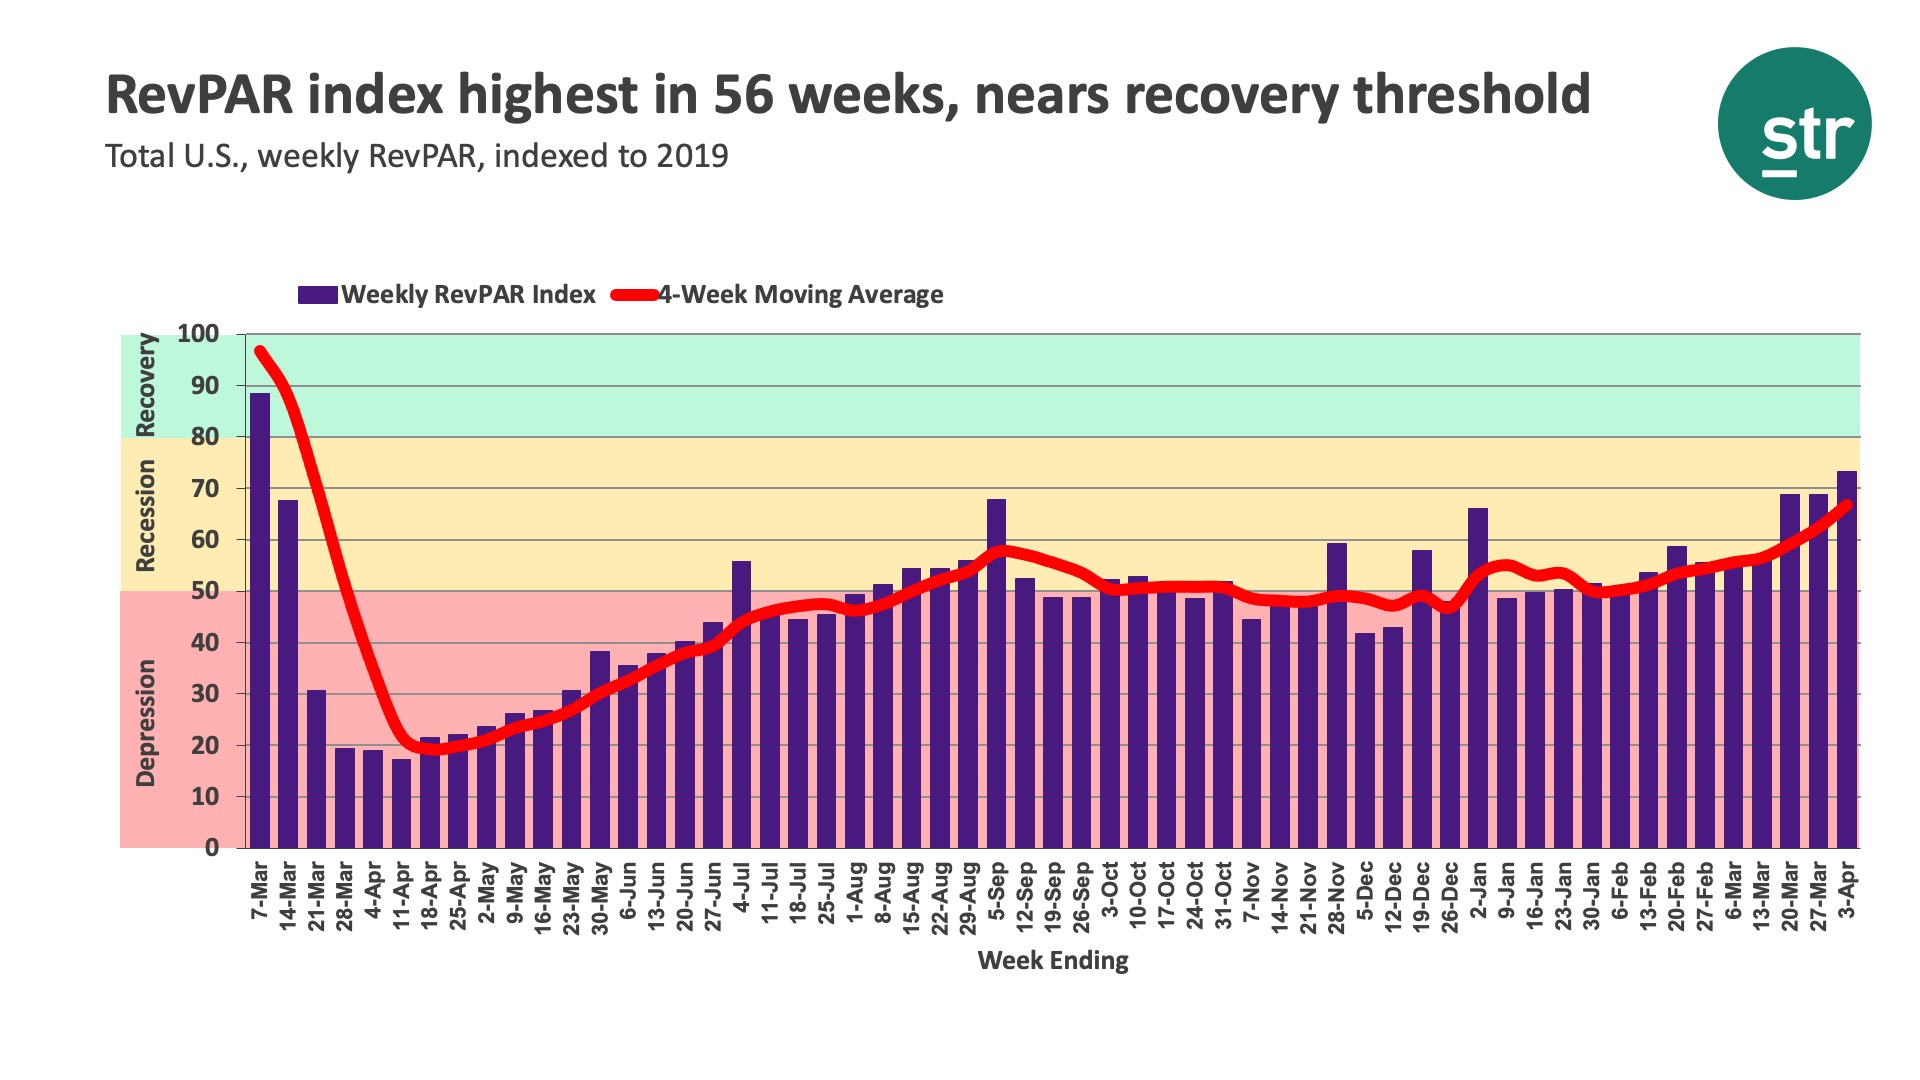
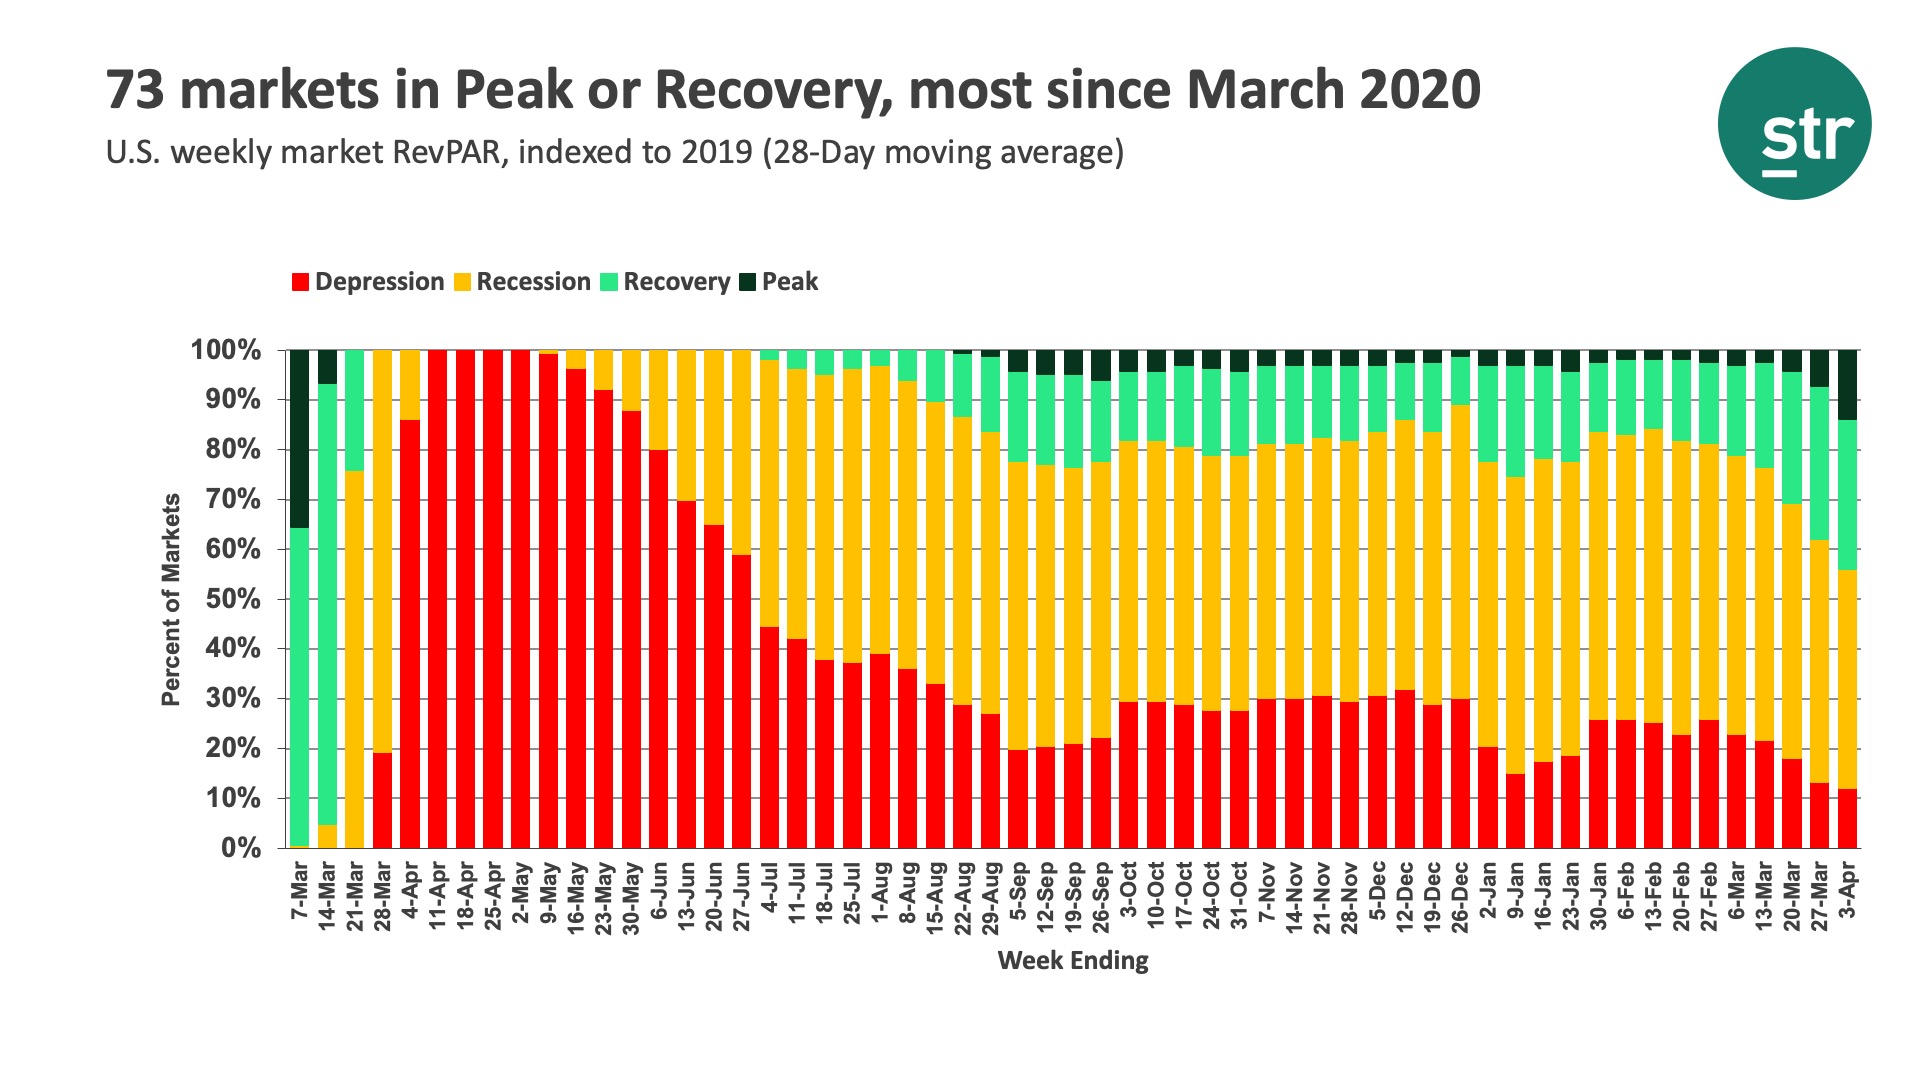
Weekly RevPAR rose to US$65.34, which was a 4.2% increase week over week and the industry’s highest level of the past 56 weeks when indexed to 2019. RevPAR has increased week over week all but three times this year. STR’s Market Recovery Monitor reflected the country’s stronger overall RevPAR performance with 73 markets either in Recovery or Peak categories. More encouraging, only 20 markets were in the Depression category, the least of the past 53 weeks. Top 25 Markets are also improving, and as a group, entered the Recession phase for the first time. However, most of the markets that are classified as in Depression continued to be those in the Top 25, including San Francisco, Boston, Washington, D.C., New York City, and New Orleans. Of all U.S. markets, those five markets had the lowest RevPAR when indexed to their 2019 benchmark. Similar trends were noted when using STR’s total-room-inventory (TRI) methodology. RevPAR on this basis was $61.76, up 3.7% with 67 markets in the Recovery or Peak categories.
Demand increased from the prior week and remained above 21 million for a third consecutive week—the weekly value was also the 10th highest of the past five quarters. The largest weekly demand gain occurred in California, whereas the largest decrease was in Texas, which was the Lone Star State’s second consecutive weekly decline. Florida also saw solid growth after posting a drop in the previous week. Demand for the Top 25 Markets hit a pandemic high, led by gains in Washington, D.C., Orlando, San Diego, and others. Among all markets, the three aforementioned markets were also the largest gainers for the week.
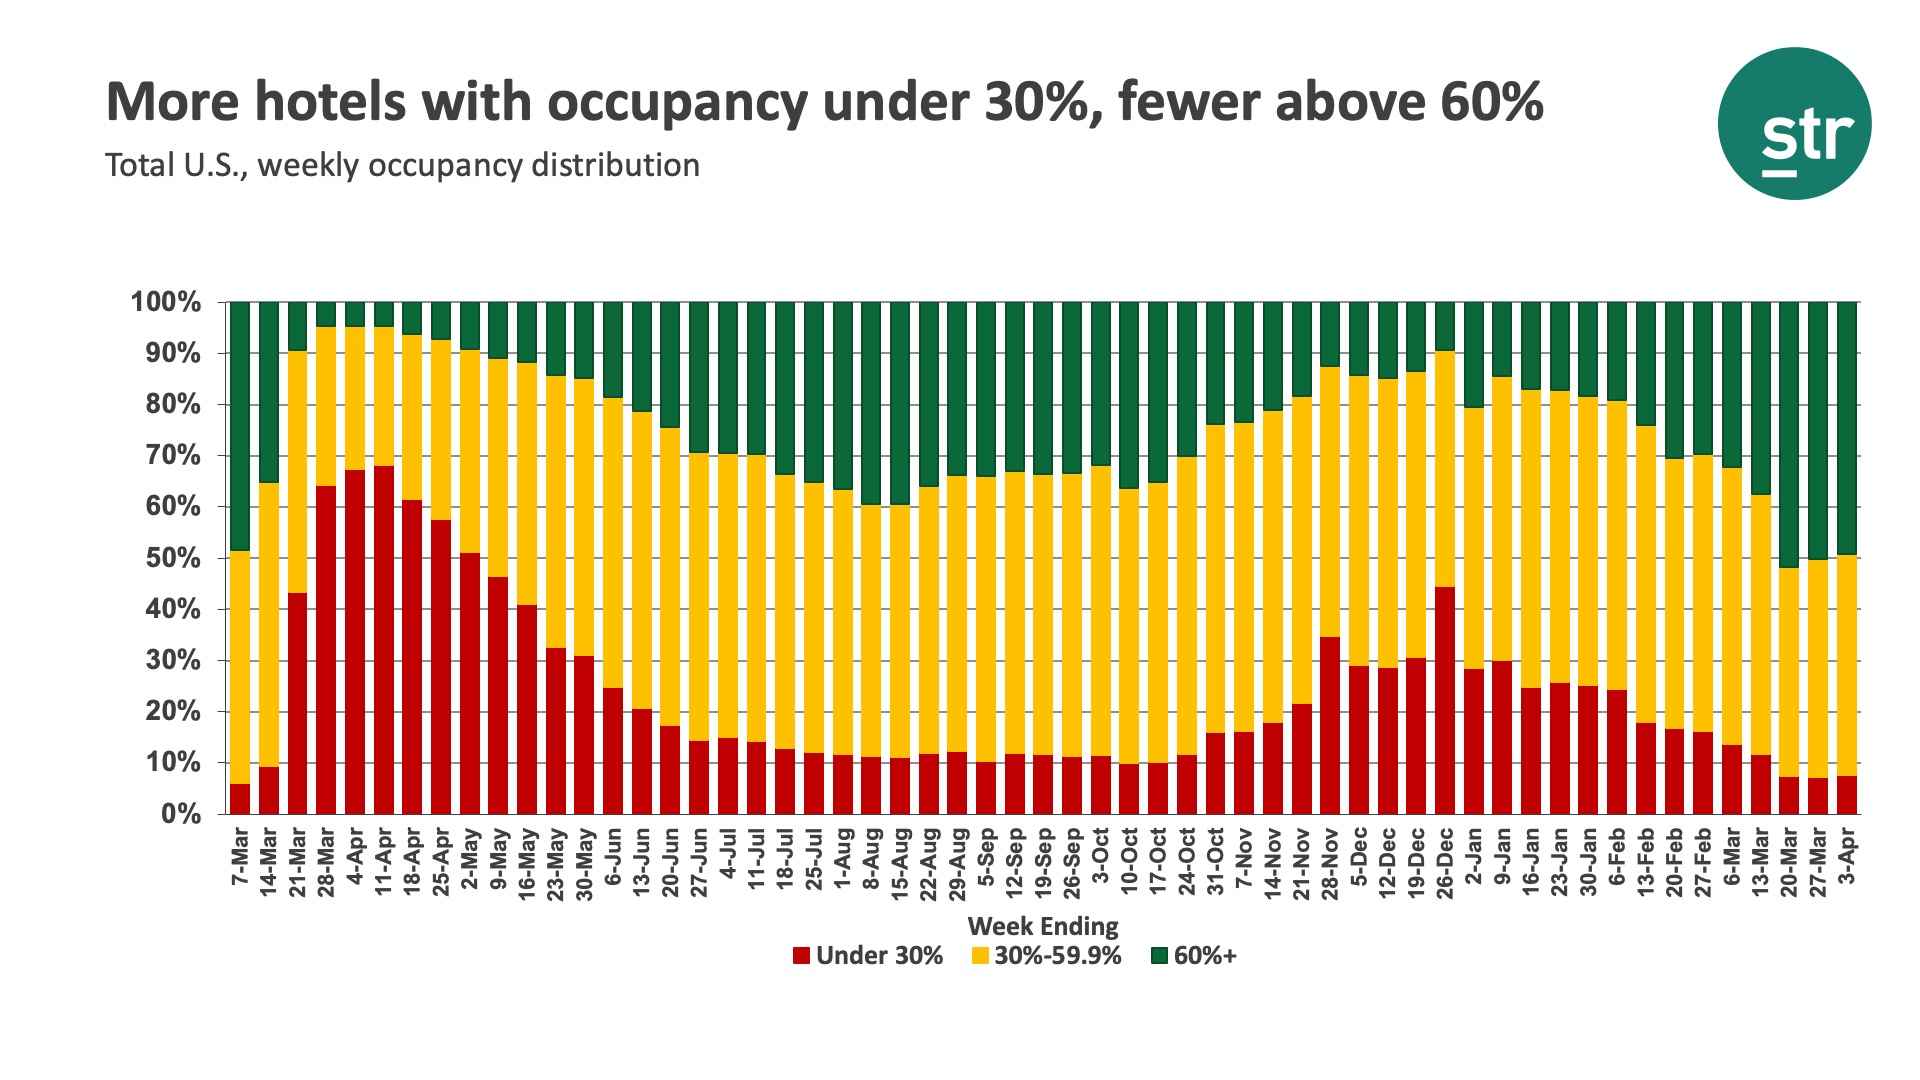
Occupancy advanced slightly but stayed below the pandemic-era high seen a fortnight ago when using both STR’s standard and TRI methodologies. Even though occupancy was up a bit, slightly more hotels saw occupancy under 30% for the week and fewer were above 60%. After two weeks above 70%, weekend occupancy fell to 66%. Weekday occupancy, however, improved to 54.7%, the best since the start of the pandemic. The Top 25 Markets were responsible for this week’s total U.S. occupancy growth. In aggregate, the major markets posted their highest occupancy of the past year with all but six markets posting weekly gains and Tampa surpassing its 2019 level. In fact, all but three Florida markets surpassed their 2019 occupancy levels. By hotel size, occupancy was flat to down for all size categories except for large hotels (300+ rooms), which saw their highest occupancy since last March. A deeper look revealed that most of this week’s occupancy growth came from large hotels in the Top 25 Markets.
ADR ($112.76) also reached its highest level of the past year with room rates for the combined Luxury & Upper Upscale class nearly back to its 2019 level among open hotels. Top 25 ADR increased by 4.4% from the prior week to its highest absolute level since the pandemic began. Overall, 40 markets saw ADR surpass the level posted during the comparable week in 2019.
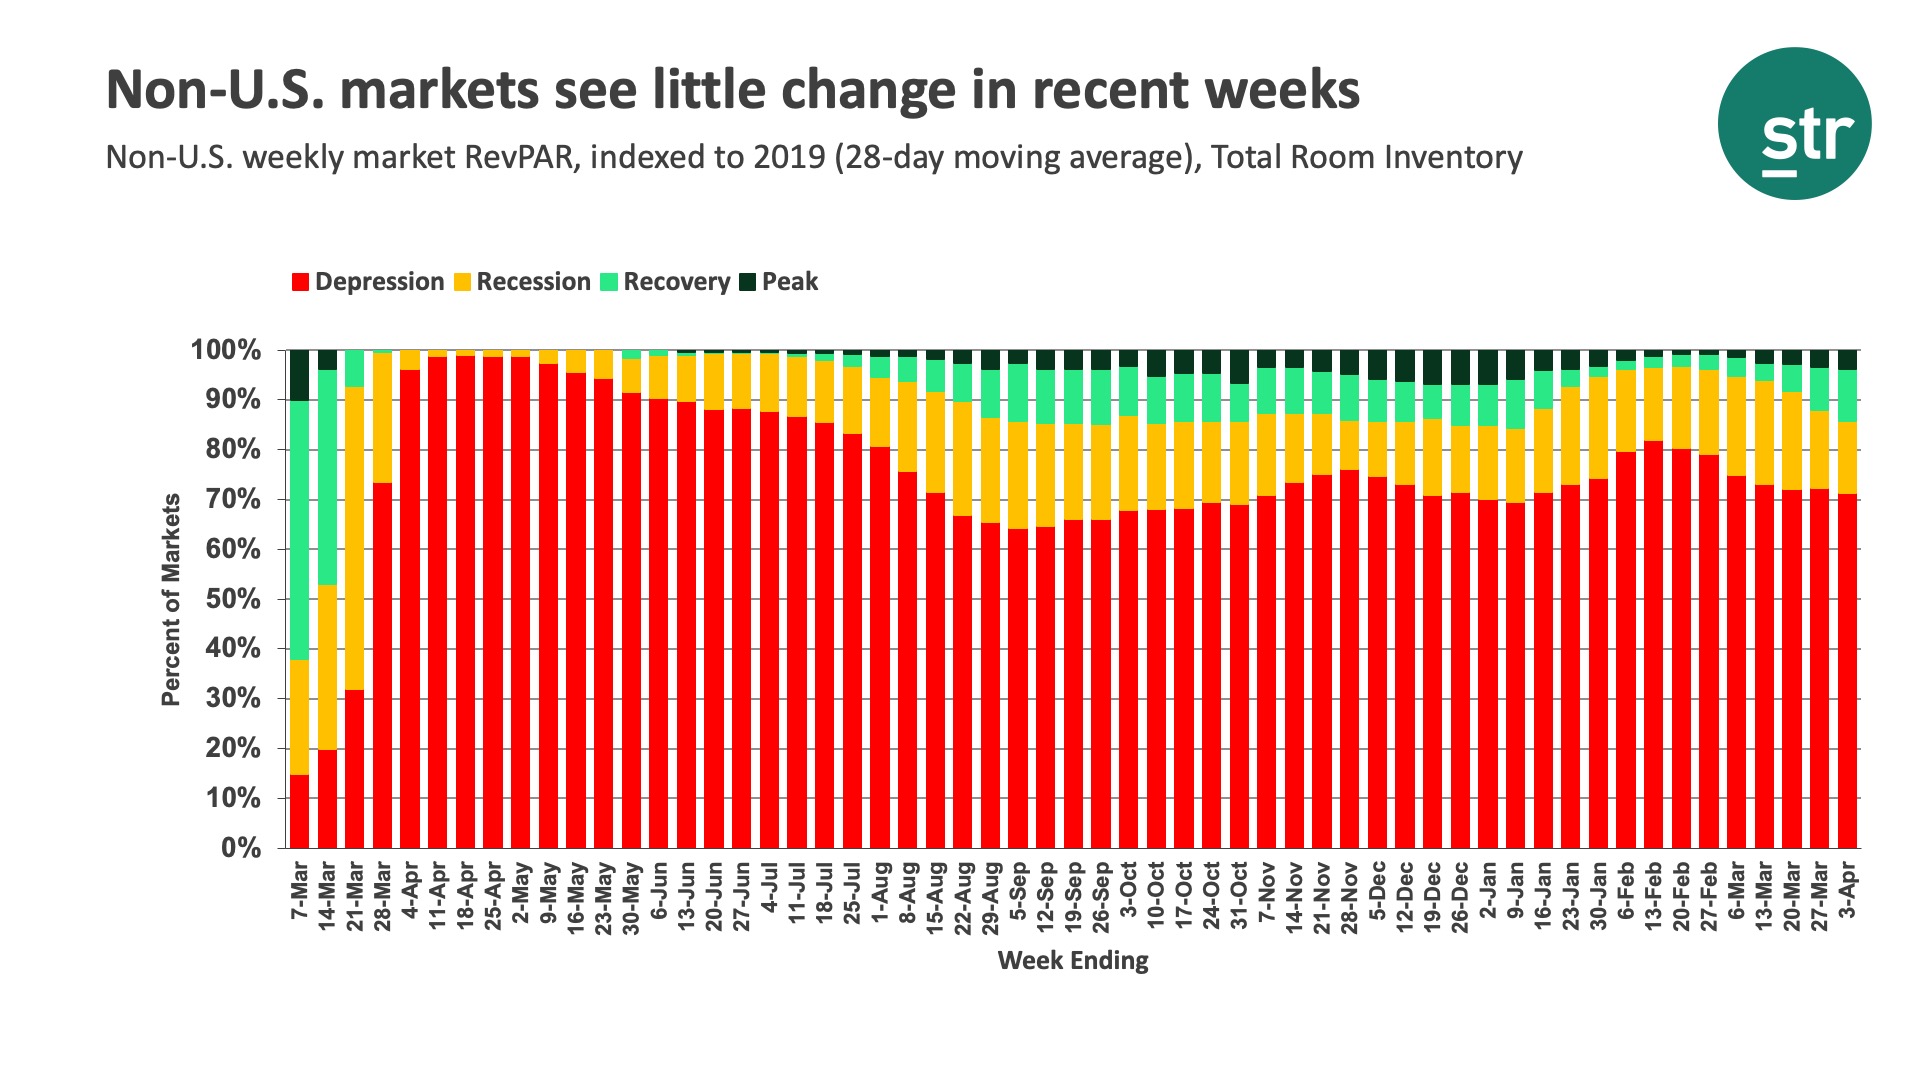
Globally, most markets remain in the Depression category with RevPAR at 39% of what it was during the comparable week in 2019. Occupancy was 30% on a TRI basis among the 351 markets reviewed. Most metrics have seen little change for some time.
With spring break-driven leisure travel winding down, we expect U.S. demand to be flat to down over the next several weeks until we reach the summer travel period. But the gain in Top 25 demand this week could be a signal of growing business travel. There’s even talk of pent-up business demand, which if true, would mitigate the anticipated softness in leisure demand. Only time will tell if that is the case.
About the MRM
When the U.S. hotel industry reached the one-year anniversary of the earliest COVID-19 impact, year-over-year percentage changes became less actionable when analyzing performance recovery. Thus, STR introduced a weekly Market Recovery Monitor that categorizes each STR-defined market based on an indexed comparison with the same time periods in 2019. An index is simply a ratio that divides current performance by the benchmark (2019 data).
For example, during the week ending 6 March 2021, U.S. RevPAR was $48.13. In the comparable week from 2019, RevPAR was $87.75. This produces an index of 54.8 ($48.13/$87.75*100), meaning RevPAR was slightly more than half of what it was in 2019.
We use an index to place each market in one of four categories: depression (index <50), recession (index between 50 and 79.9), recovery (index between 80 and 99.9), and peak (index >=100). Additionally, we highlight other top market performances that contribute to higher levels of recovery across the U.S.
To learn more about the data behind this article and what STR has to offer, visit https://str.com/.


Sign up to receive our stories in your inbox.
Data is changing the speed of business. Investors, Corporations, and Governments are buying new, differentiated data to gain visibility make better decisions. Don't fall behind. Let us help.


Sign up to receive our stories in your inbox.
Data is changing the speed of business. Investors, Corporations, and Governments are buying new, differentiated data to gain visibility make better decisions. Don't fall behind. Let us help.


