
The multifamily industry has been off to a hot start to 2021 after a challenging 2020. New deliveries through April were up considerably, but so was apartment demand. Robust demand has been a continuation from the recovery that began in Q3 2020, but the difference so far this year is the reappearance of rent growth. Some differences emerge at the price class level that give some indication as to how the multifamily bounce back is unfolding, and this will be our newsletter topic for this month.
ALN assigns conventional properties of at least 50 units to one of four price classes, A through D, based on a property’s average effective rent per square foot percentile ranking in its market. This allows for a clearer apples-to-apples comparison of market segments around the country. One other important methodological note is that not all new units delivered will immediately be assigned a price class. A new property could be below the 50-unit threshold, in which case it would not receive a classification, or it could be still too new for ALN to have floor plan-level rents from which to base a designation.
Nationwide View
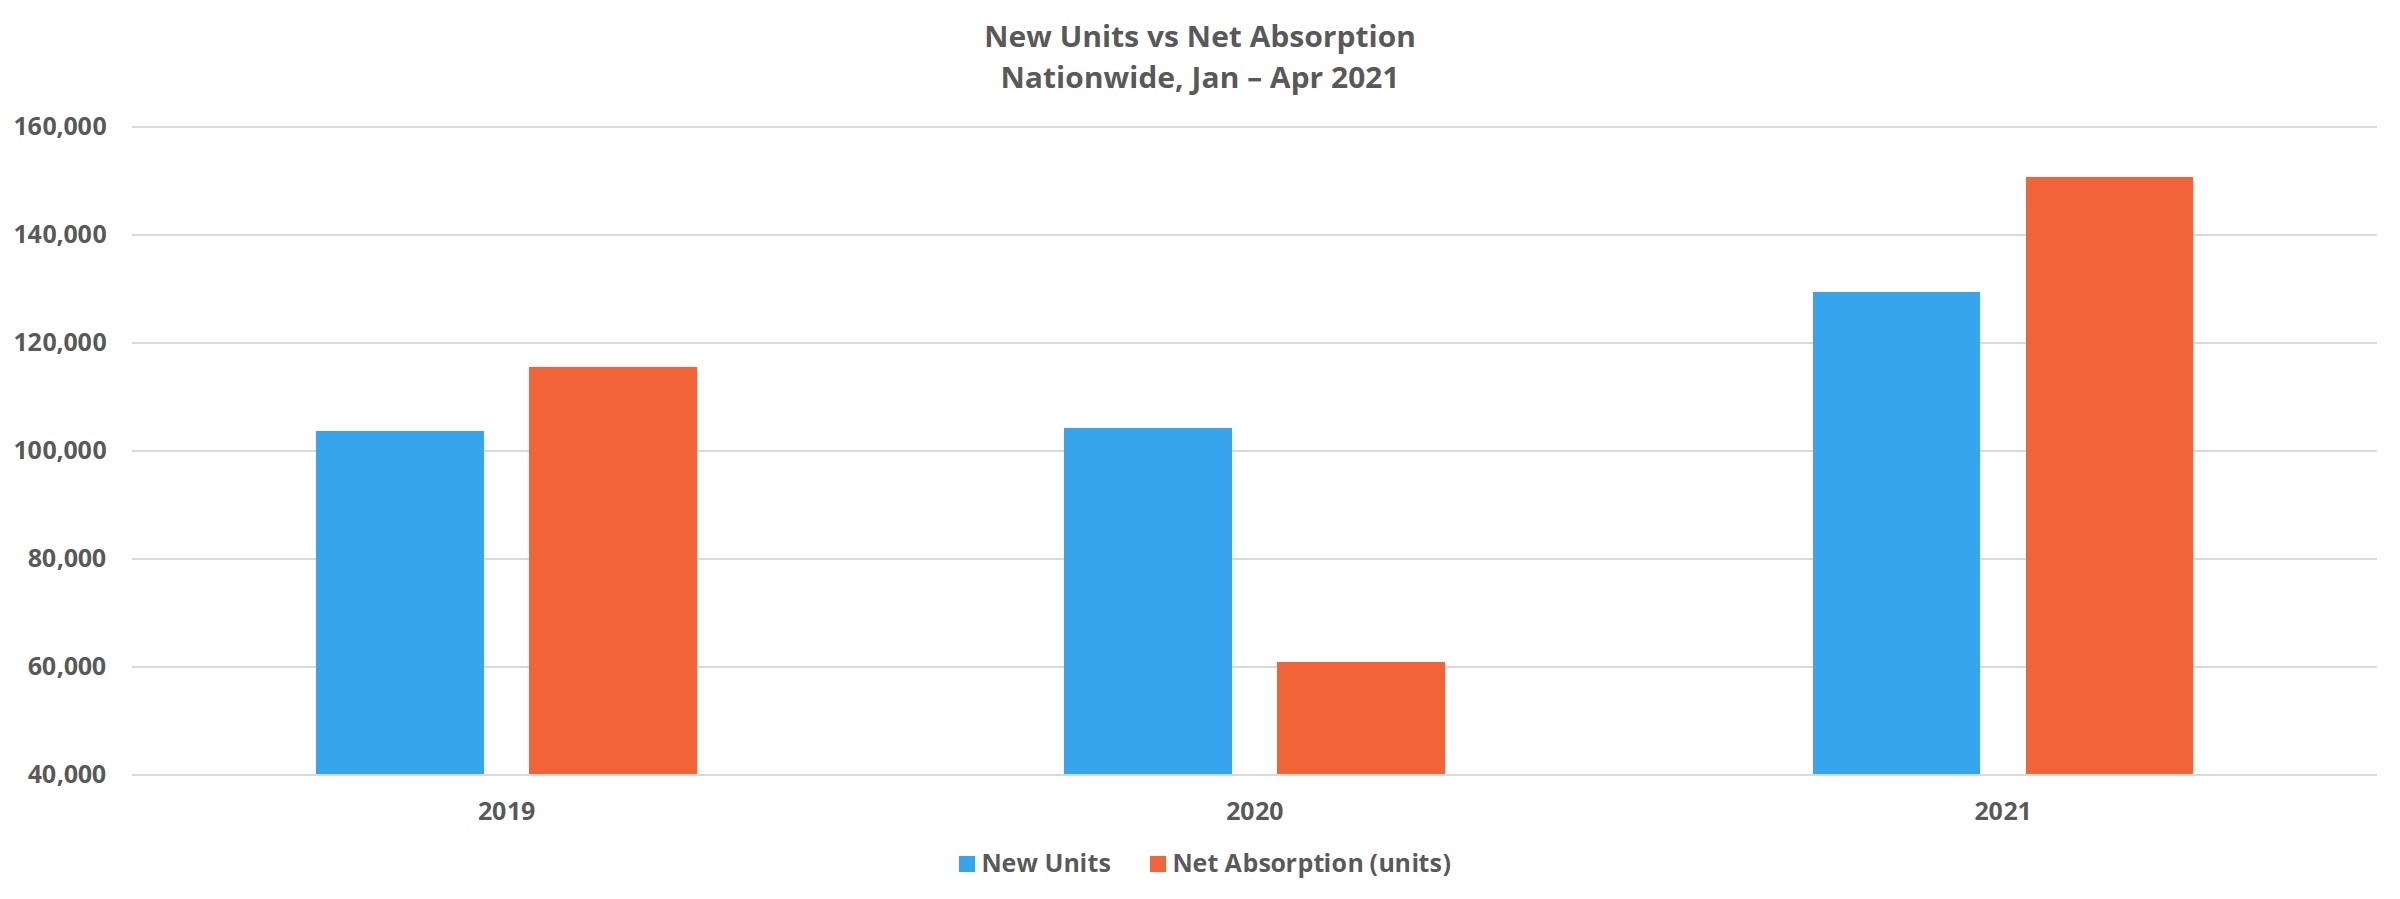
Before diving into the price class numbers, a quick overview of the national picture will provide some helpful context. Just fewer than 130,000 new conventional units were delivered across the country through the first four months of the year. This represents a notable increase from recent years when new supply was in the range of 100,000 to 115,000 new units for this portion of the calendar.
Even with an active construction pipeline, national average occupancy rose by 0.2% to 92%. Thanks to strong pent up apartment demand, this was the best result of the last few years. Just more than 150,000 net units were absorbed through April of this year – once again easily outpacing recent years. Last year, April was the first month that the effects of the COVID-19 pandemic began to appear in the national multifamily numbers. As a result, net absorption for the same portion of the year was only about 61,000 units.
As already stated, the recovery in multifamily demand began last year, but rent growth remained elusive. Now, with three consecutive quarters with healthy absorption in the books, rent growth has reemerged. From January through April average effective rent rose by 2.1% to bring the average unit to $1,389 per month. As with new supply, net absorption, and average occupancy change, this average effective rent gain was the strongest of the last few years. 2017 was the last year with stronger rent growth through April, though by a slim margin. Aiding rent growth was a draw down in both the availability of lease concessions as well as the average discount value. Concession availability saw the larger move, with a 9% reduction bringing the percentage of conventional properties offering a discount to 18%.
Class A
Around 49,000 new price Class A units entered the market nationally through April. This volume was slightly higher than in 2020 and well beyond the approximately 41,000 new Class A units from the same portion of 2019. Even with pressure from the new construction pipeline, Class A properties managed the largest gain in average occupancy of the four price classes with a 0.7% improvement through April to just above 84%. This improvement in average occupancy was thanks to robust net absorption to the tune of about 49,000 units. While new supply barely outpaced that of last year, this level of apartment demand was significantly ahead of not only last year, but 2019 as well. In fact, this year’s value was more than 50% higher than that from 2019.
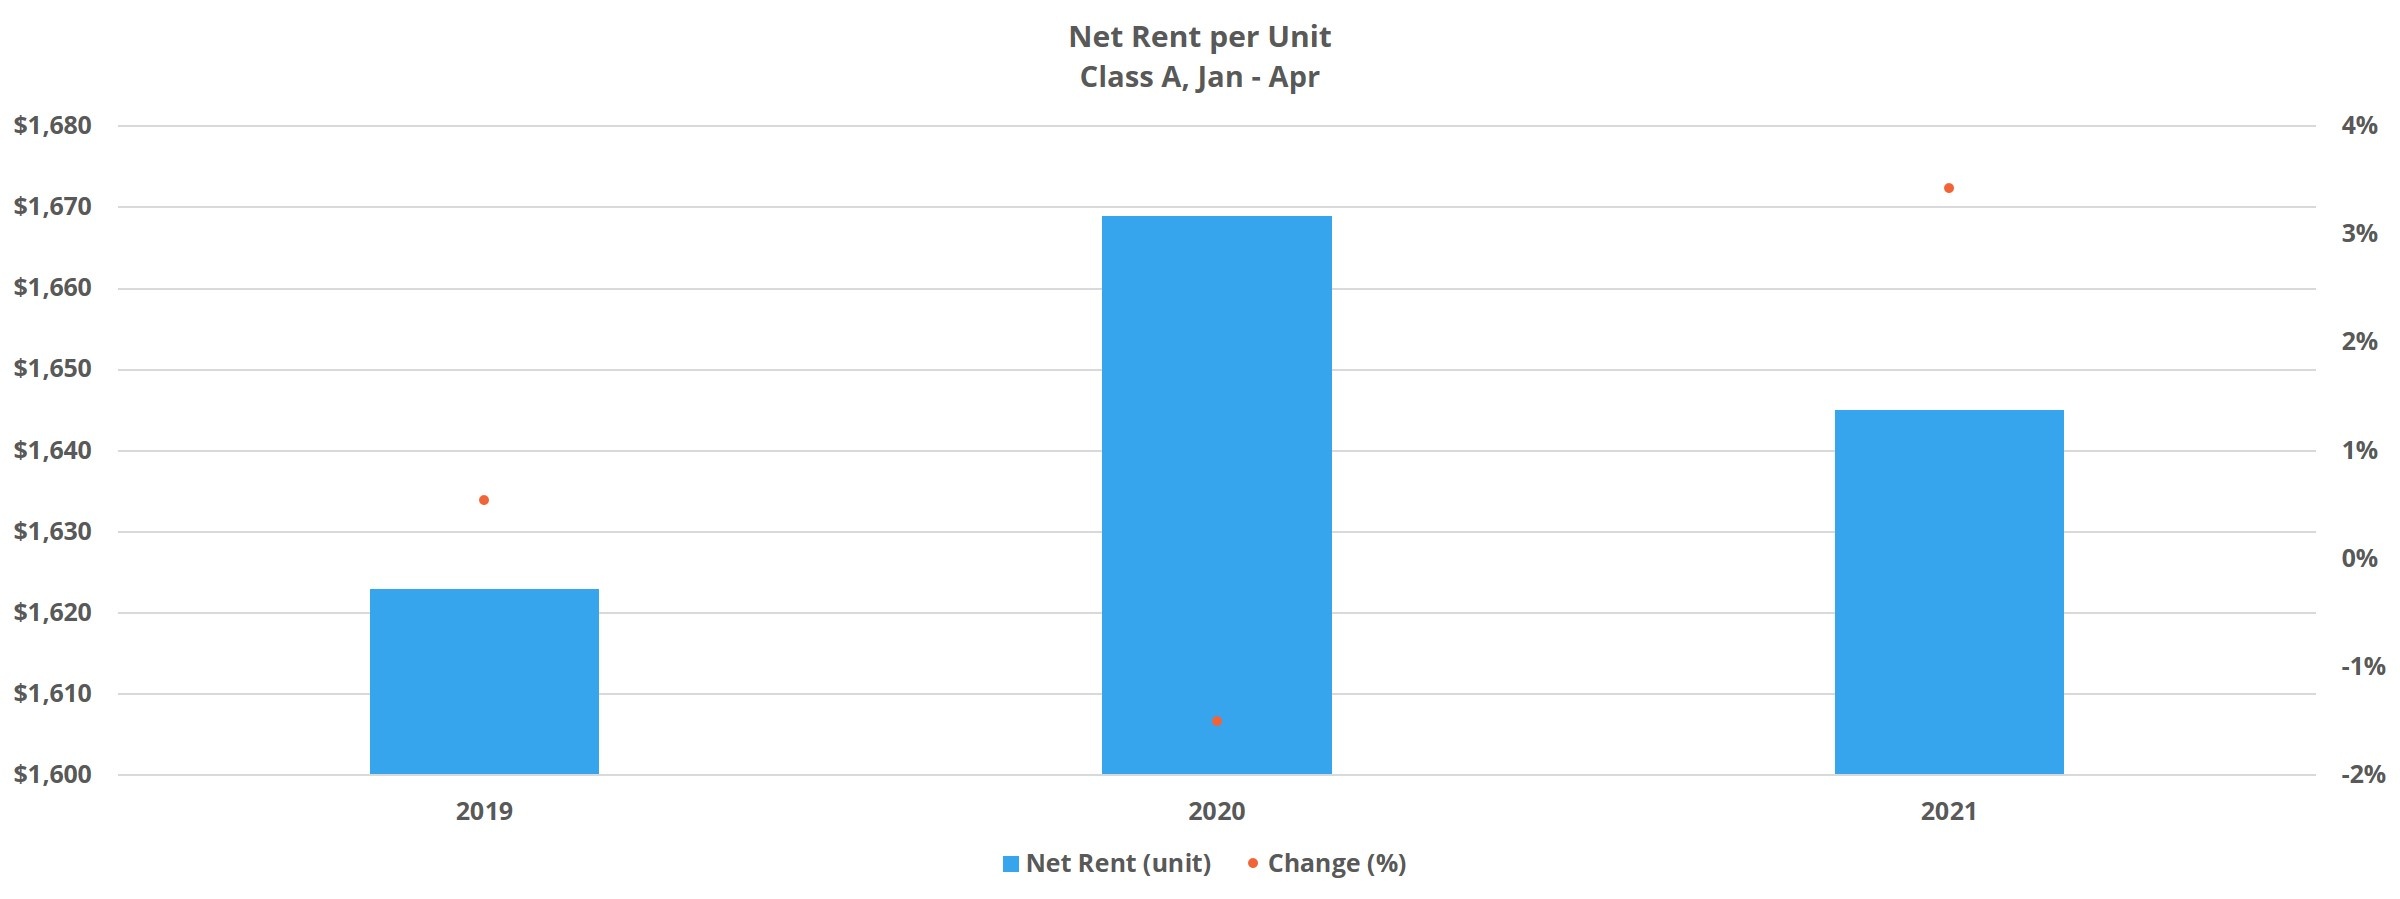
After a rough 2020 for Class A rent growth, the tide turned with the calendar and rent growth for these properties was 2.7% through April. More encouragingly, this growth was not fueled only by expensive new units entering the market. Isolating just Class A properties that entered the year already stabilized only moves the average effective rent growth value down to 2.5%. Markets that especially stood out in the period for Class A rent growth include San Bernardino – Riverside, Las Vegas, and Orlando. Aiding in the rent gains was a pronounced decrease in lease concessions – both in availability and average value. About 27% of Class A properties ended April offering a lease concession, down almost 20% from the start of the year. The average discount value remains high at five weeks off an annual lease but has come down by 8% since the start of 2021.
[
](https://alndata.com/takeaways-episode-9/)Class B
About 41,000 new units entered the market as price Class B units through April. This new supply was more than 30% higher than that from the same portion of last year and surpassed the level of new supply from 2019 by an even wider margin. The increase in new units coming in as Class B is partially a reflection of increasing development in the suburban and more outlying submarkets of many markets. Especially in the largest markets, Class A units tend to be concentrated in one or two areas around the urban core. Here too, as with the Class A subset, demand was more than sufficient for these new units – and by an even wider margin. Approximately 48,000 Class B units were absorbed in the period compared to only 19,000 through April of 2020. Even pre-pandemic in 2019, Class B net absorption through April was only 29,000 units. The result of this robust absorption was an average occupancy increase of 0.5% to just above 91%.
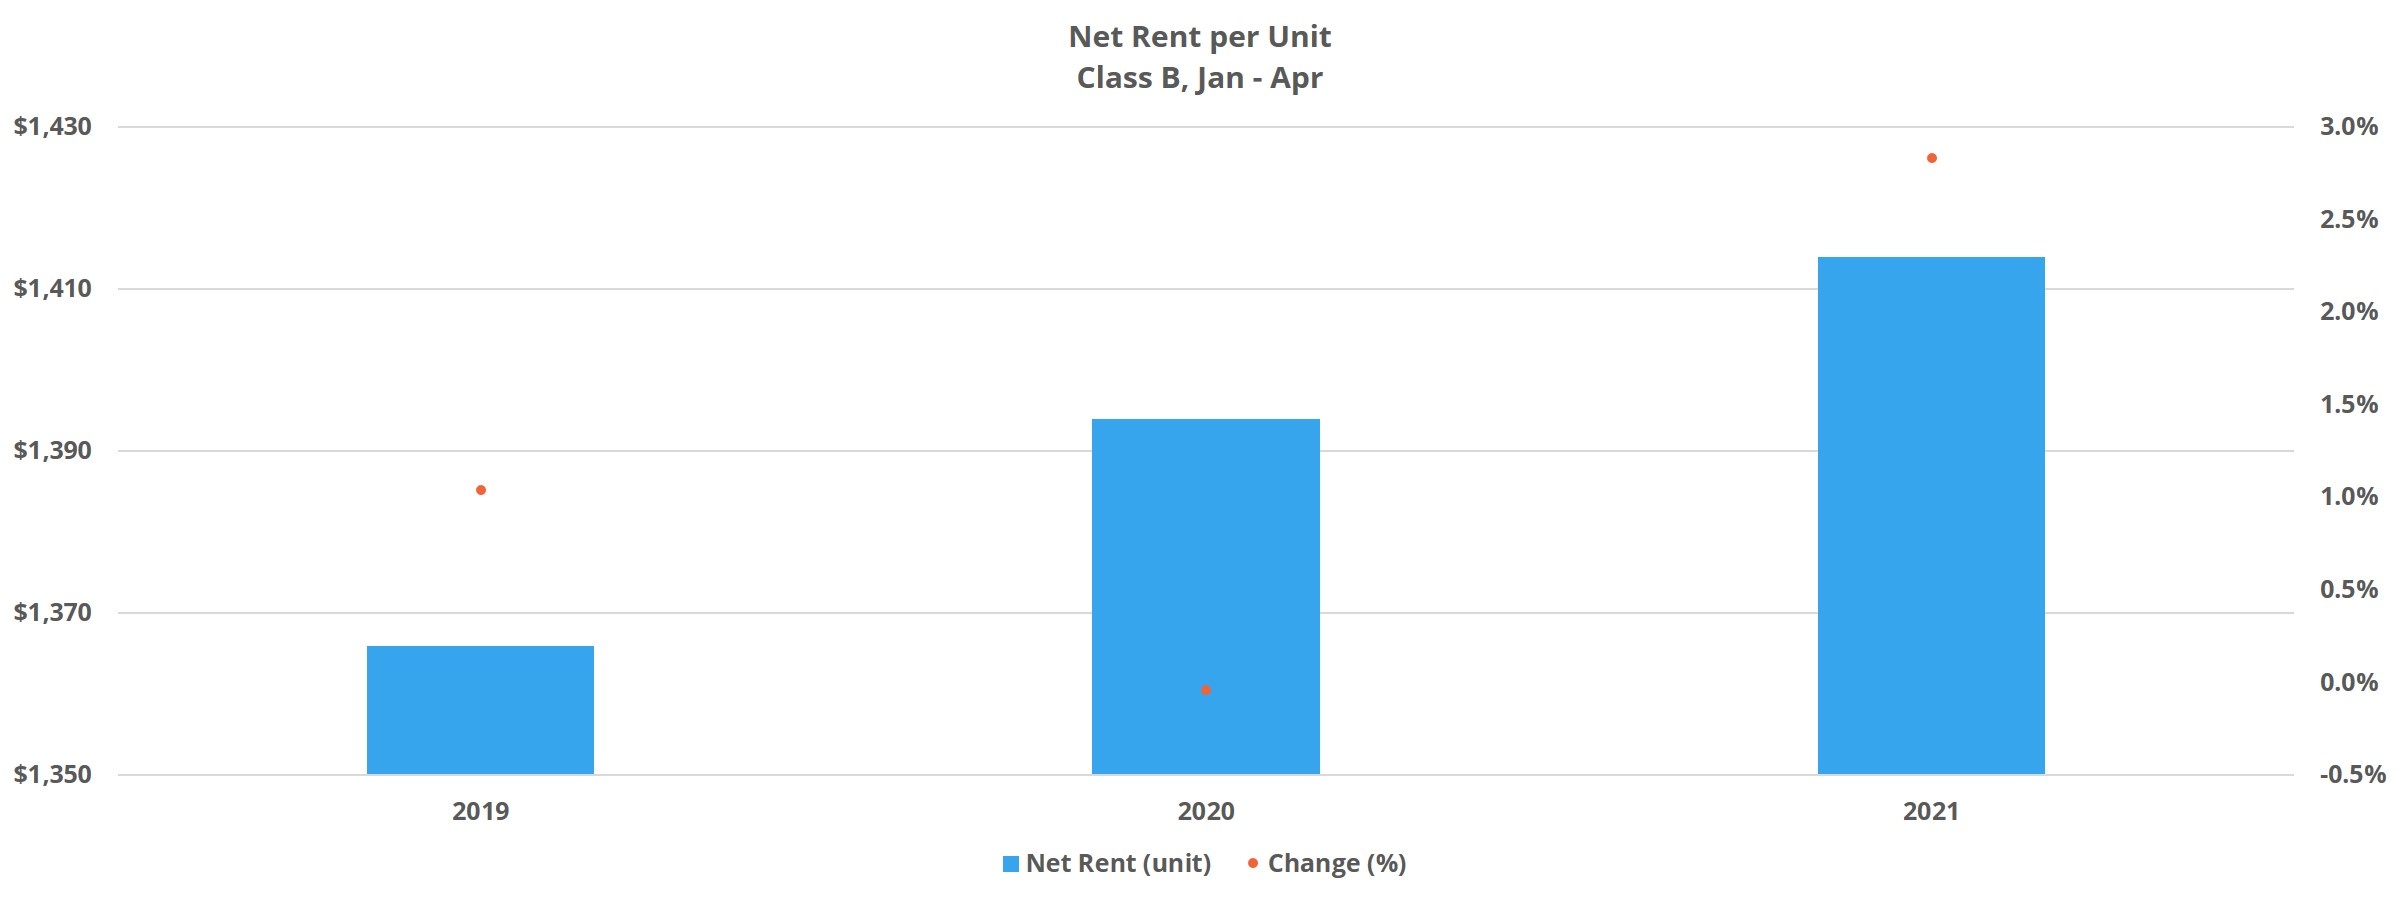
Average effective rent growth for this group was 2.4%, just behind the 2.7% gain for Class A. This appreciation was four times higher than last year’s result and almost double the rent growth from the same portion of 2019. Interestingly, rent growth was strongest within the Class B category in secondary and tertiary markets. One reason why rent growth was a little below that of Class A was less of a decrease in reliance on lease concessions. While the availability of discounts did drop by 15% to about 21% of properties offering, the average discount value remained unchanged t almost five weeks off an annual lease.
Classes C and D
Without the same type of new supply pressure, but also with generally higher occupancies, average occupancy movement tends to be more muted in these tiers. This has held true through April of 2021. Net absorption more than tripled that of the same period last year, and above the 2019 figure as well. Class C properties experienced a 0.4% average occupancy gain to 94%. In the Class D group, demand far outpaced last year, but was about 2,000 units short of the 2019 level. The result was a 0.2% average occupancy gain to just above 94%.
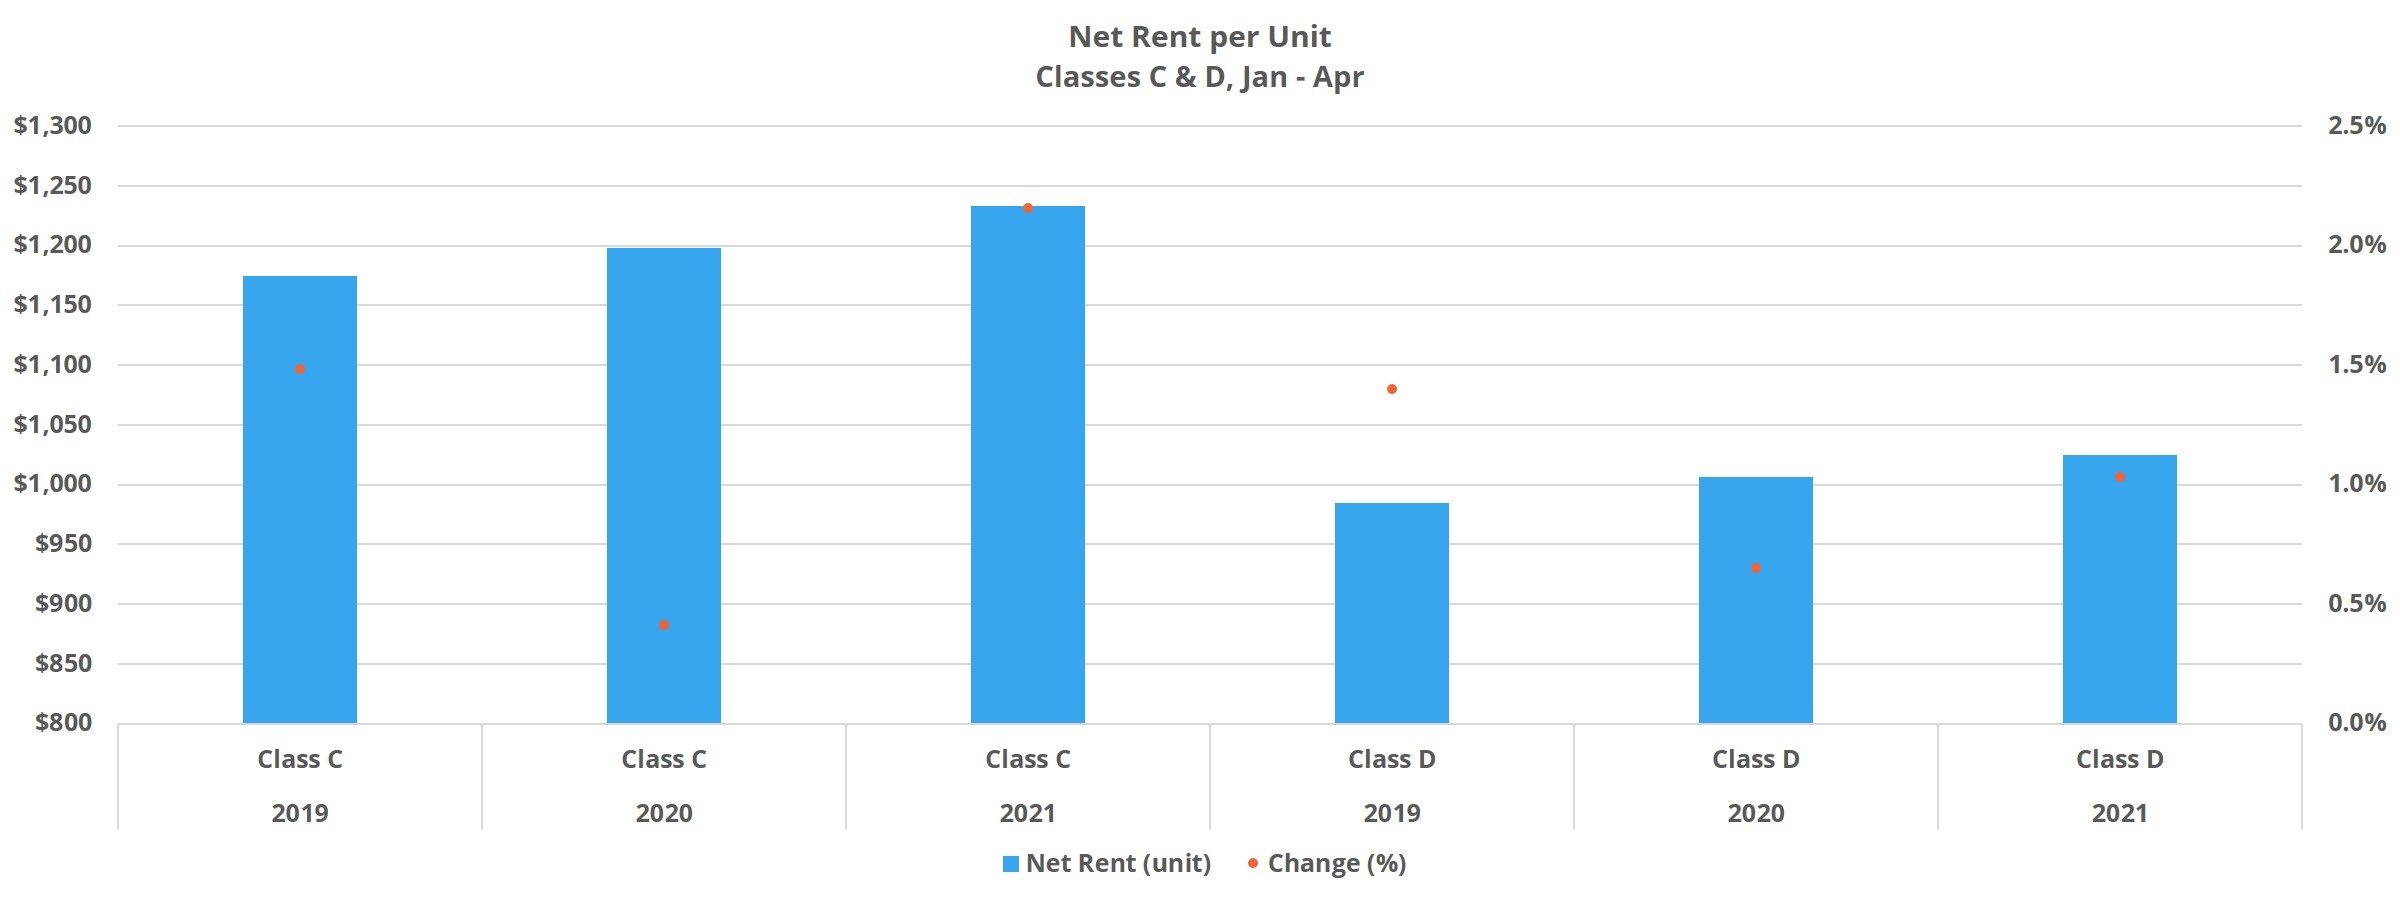
Rent growth was predictably lower for these classes compared to the top two tiers. Class C average effective rent rose by 1.8% to $1,313 per unit while the Class D gain of 0.8% brought the average unit to $1,088 per month. Rent concessions continue to play a more prominent role for these properties. Though the availability of rent discounts decreased for Class C properties by about 8% through the first four months of the year, the average discount value increased to nearly four weeks off a 12-month lease. For Class D properties, both concession variables increased. A small increase of about 3% in discount availability was overshadowed by a 9% increase in the average concession value. That increase brought the average to just below five weeks off an annual lease.
Takeaways
On a national scale, the start to 2021 has been a good one for multifamily. Average occupancy and average effective rent change have been positive across all four price classes as a result of robust apartment demand across the board. Only Class D properties did not manage to outpace the net absorption total from the same portion of 2019, though each tier substantially surpassed the 2020 results which were affected by the early days of the pandemic.
Rent growth has been stronger in the top two price tiers. This makes sense given the make-up of the residents in these properties relative to the employment situation – residents tend to have jobs more easily converted to remote work and are less affected by lay offs in the hospitality, service, and retail sectors. These top two price classes, and particularly Class A, also took the biggest hit to average effective rent in 2020, so there was more ground to re-take.
Looking ahead, the continued vaccine rollout and increasing economic activity should provide an opportunity for price classes C and D to continue to rebound as we move through the traditionally stronger second and third quarters. One factor that continues to add some uncertainty is the expiration of the eviction moratorium, but multifamily demand appears more than able to pick up any associated occupancy pressure. In the big picture, short of a further unforeseen calamity, the industry should be primed for a strong bounce-back 2021.
To learn more about the data behind this article and what ALN Apartment Data has to offer, visit https://alndata.com.


Sign up to receive our stories in your inbox.
Data is changing the speed of business. Investors, Corporations, and Governments are buying new, differentiated data to gain visibility make better decisions. Don't fall behind. Let us help.


Sign up to receive our stories in your inbox.
Data is changing the speed of business. Investors, Corporations, and Governments are buying new, differentiated data to gain visibility make better decisions. Don't fall behind. Let us help.