Source: https://www.placeiq.com/2021/06/placeiq-pwc-recap-rethinking-demand-models-for-the-pandemic-era/
The pandemic raised new questions, new challenges, brought new opportunities, and accelerated the need for data-driven decisions across many industries. We recently teamed up with our partners at PwC to share our approach for enhancing existing demand models using multiple datasets and to show an example of how they’re built in the PwC ecosystem.
We discussed from our respective points of view how demand changed, and how it can affect your planning.
PwC shared some of their main findings derived from market research, including:
With these constant shifts in behaviors, the common question is still – Are we going to come back to normal behaviors, and to what degree are we going to be back to normal?
The answer to this question will vary by category. For restaurants and retailers, simplification is the model across the board – 2020 brought about new trends for delivery and pickup and an acceleration in subscription buy-in. Consumers are also obtaining more category knowledge – which is a plus for all marketers out there.
As mentioned in our previous Social Distance Tracker, travel habits and activities have also shifted in important ways. Hotels continue to be the top visited place after arrival. Road trip oriented places like Convenience Stores and Car Rental agencies are doing well. But urban activities — bars, casinos, malls, and theme parks — have dropped significantly in ranking. These venues are still visited, but this category has only inched towards reemergence.
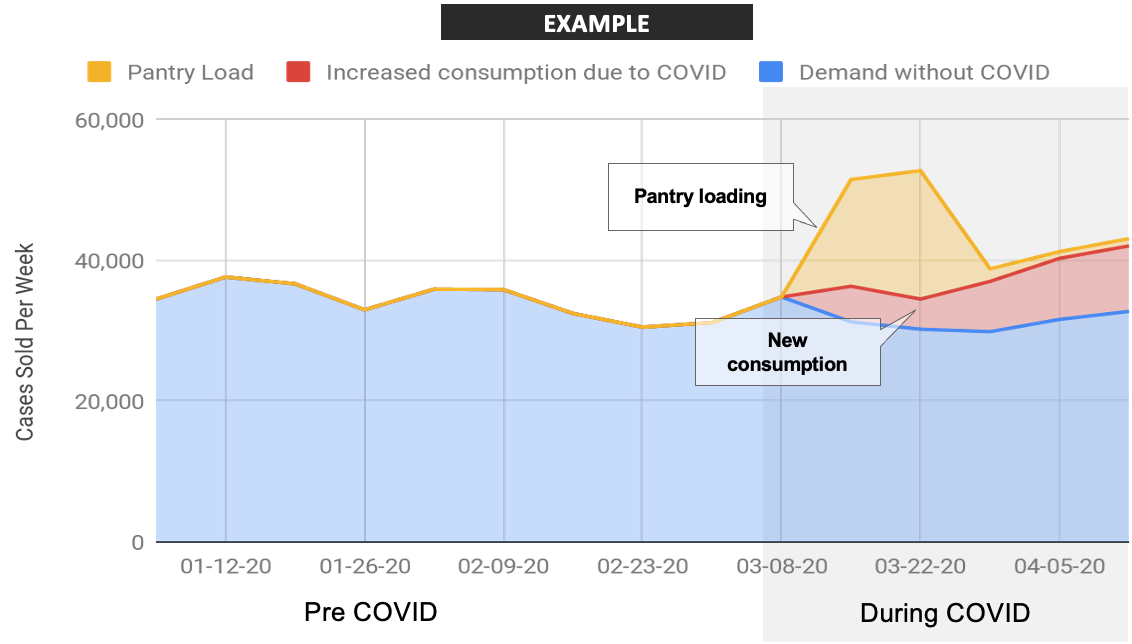
So, how do we forecast demand in the future? The past year has caused shifts for demand models that we could not have anticipated, and we are constantly looking for new drivers for these models. There are new trends for consumption, and artificial consumer behaviors – like pantry loading – have increased.

Below are some examples in CPG and Retail which shared challenges, but are rebounding differently.

Consumer patterns will continue to shift
Our EVP of Strategy, Drew Breunig, met with over 100 executives in Q1 2021 to share our understanding of the year and how we see mobile devices moving in the world. Drew often answered the questions:

Based on the 2020 data and findings, he explained what those visitations tell us about how consumers have reacted to covid.
Drew was also frequently asked – If my business has been doing very well during the pandemic, will customers stop visiting me once restrictions are lifted? A good example of this is Drive-In movie theaters and how that relates to indoor Movie theaters. 2020 was a banner year for Drive-Ins, and now they’re concerned about Movie theater reemergence as consumers may revert to their old habits. We’re seeing a mix of wanting to return to normal versus continuing on your new habits during covid. This explains the importance of looking at the data and building new demand models during this era.
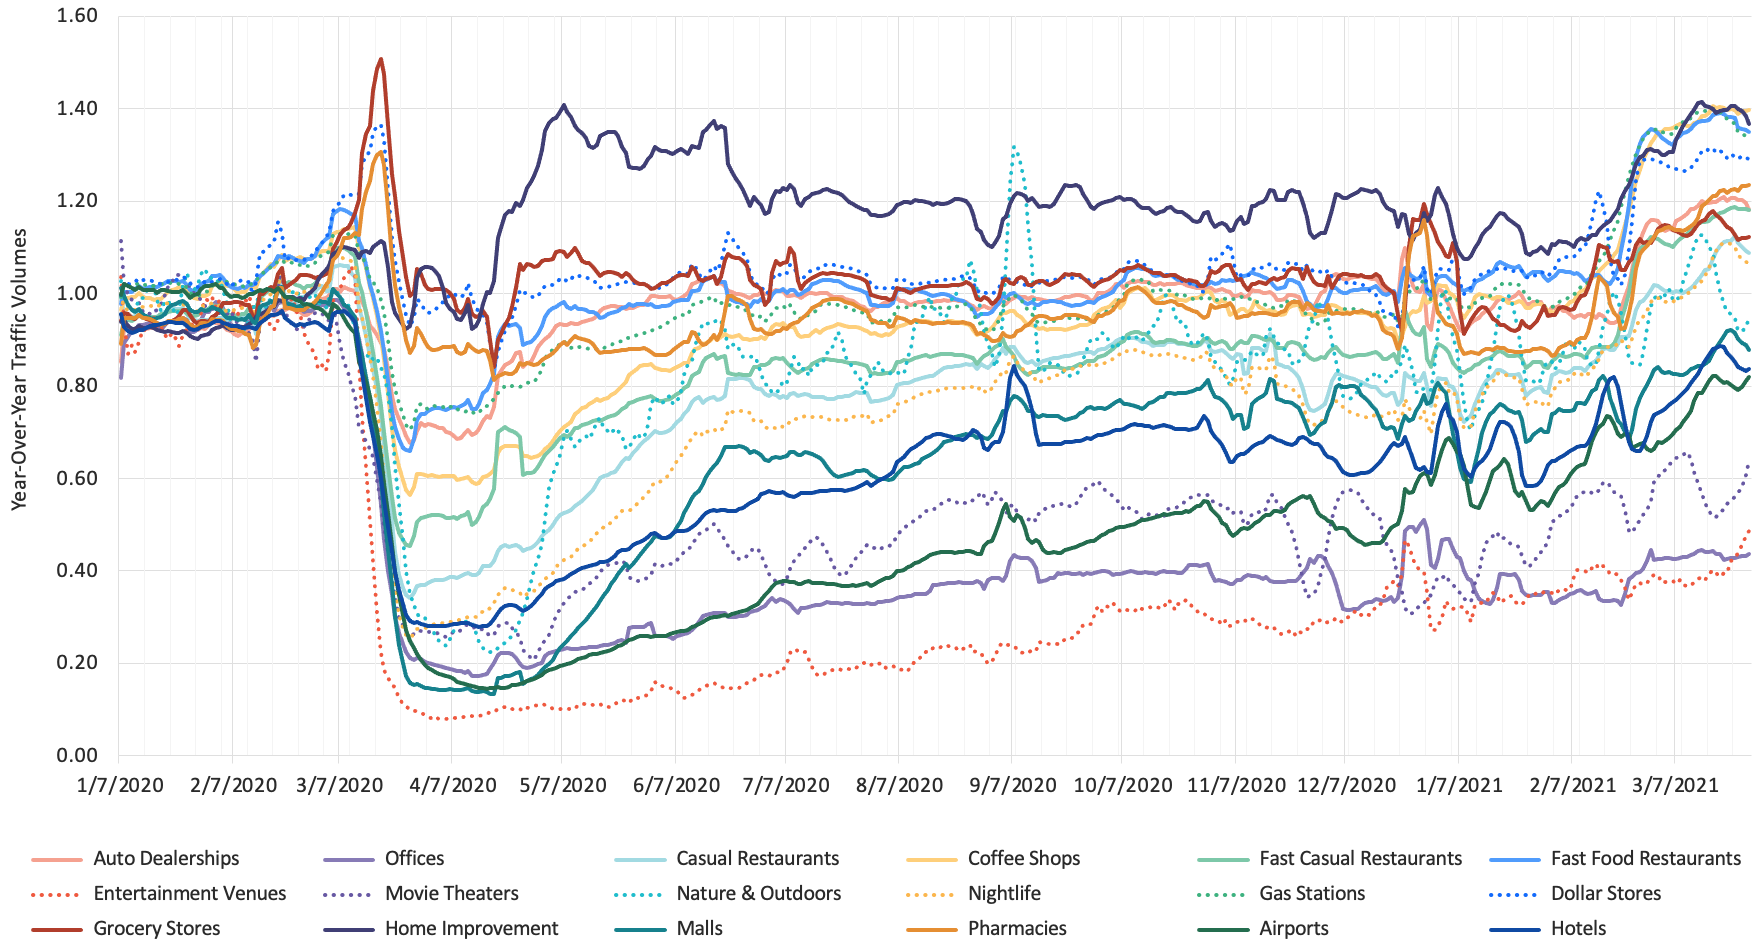
Demand is not just going to be a quick snap back to normal- it’s going to be a gradual, intermittent, stop-start reveal and some behaviors are going to stick. So, what does PlaceIQ’s location data – and how we see devices move throughout the world – reveal about change in demand patterns? Let’s start with an example of how Home Improvement stores performed in 2020.

When Covid hit, Hardware and Home Improvement stores, shown in the top light purple line, had a record year of sales as people were at home more often. In data from April 2020, we saw these stores jump to a 40% increase in traffic and they’re still at 20% higher than normal traffic pre-covid.
This year, around February 20th, we saw a huge increase in foot traffic due to many different factors – covid cases down, vaccines starting, and the nice weather returning. It still did not affect each category in the same way, the categories that are still empty because of risk (movie theaters, nightlife, offices) are still low and waiting for safe return.

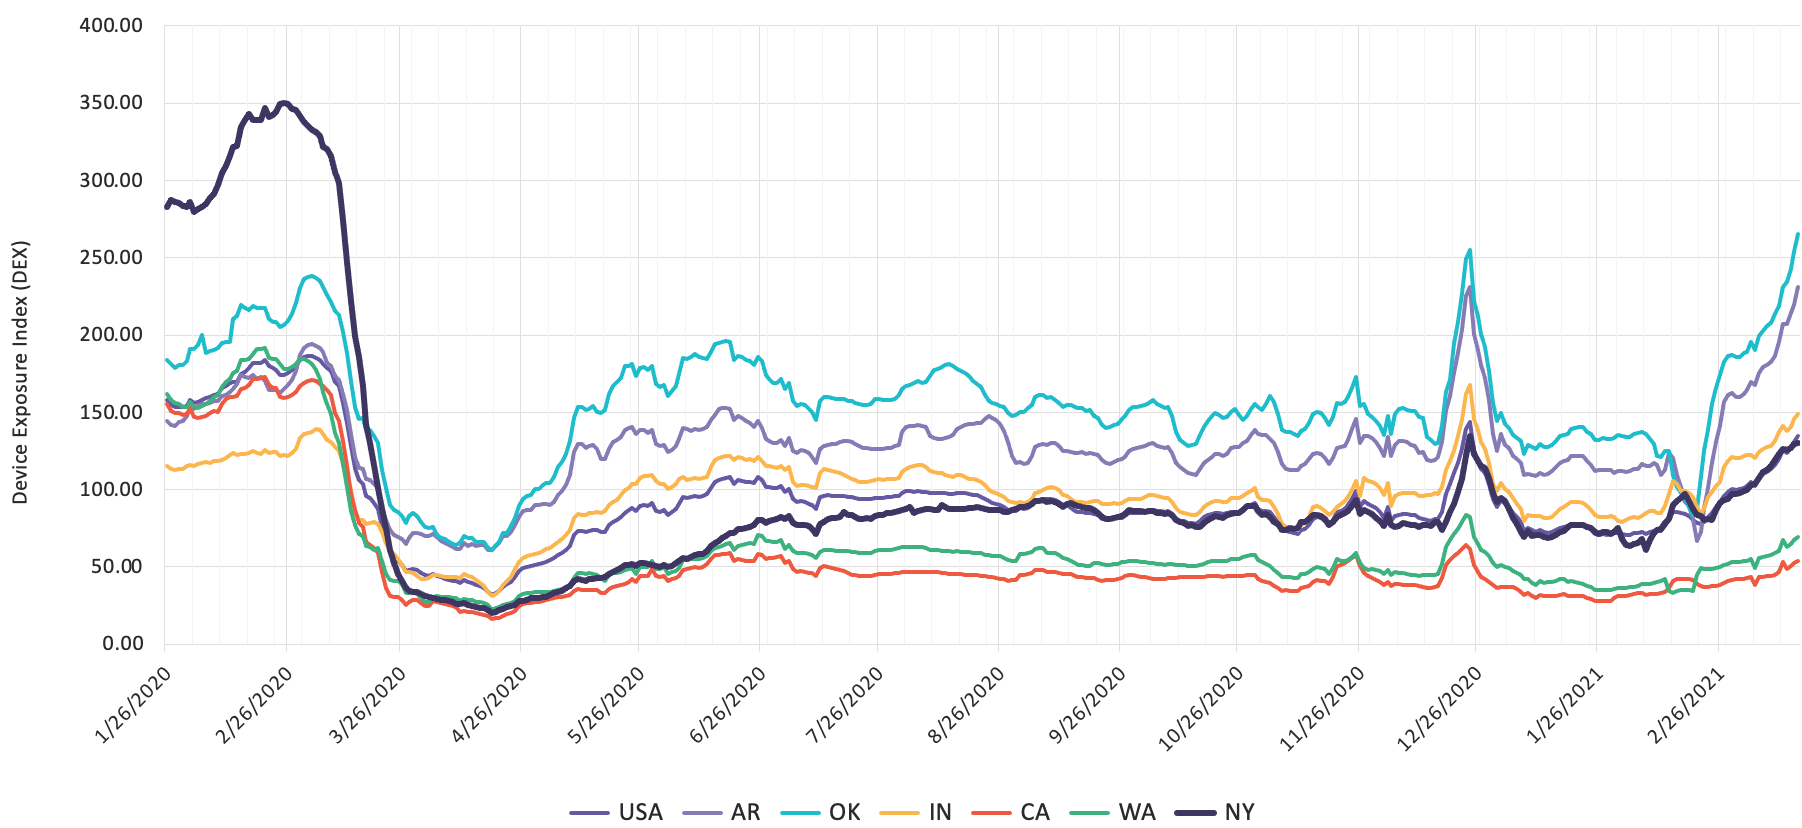
As you can see in the above chart, a consumer’s comfort level for reemergence is based on the region and outside factors (like government regulations) in that specific region. Our data also provides a look at the data down to a county level for a more granular view of foot traffic reemergence per category.
Key Takeaways:
To learn more about the data behind this article and what PlaceIQ has to offer, visit https://www.placeiq.com/.


Sign up to receive our stories in your inbox.
Data is changing the speed of business. Investors, Corporations, and Governments are buying new, differentiated data to gain visibility make better decisions. Don't fall behind. Let us help.


Sign up to receive our stories in your inbox.
Data is changing the speed of business. Investors, Corporations, and Governments are buying new, differentiated data to gain visibility make better decisions. Don't fall behind. Let us help.


