And that’s a wrap! Amazon Prime Day was another success for the eCommerce giant, check out our exclusive coverage of results first.
Shoppers came ready to open up their wallets on Prime Day. Revenue jumped nearly 600% compared to the daily average in the 20 days leading up to the two-day event, an increase that was almost double that of product views (+353%) and unit sales (+365%). To help understand consumer behavior driving this Prime Day performance, we used Shopper Intelligence, our eCommerce Intelligence platform, to break down trends on a category and brand level, with exclusive insights from our industry experts.
Amazon Prime Day: Everything you need to know
Amazon Prime Day has become an annual summer event that boosts online shopping at an otherwise historically slow time of year. Due to COVID-19, Amazon was forced to push Prime Day 2020 from July to October last year. However, in 2021, it returned to its summer slot.
Amazon Prime Day 2021
The retail event which marks its six-year anniversary, has lifted not only Amazon, but created a “halo effect” on other retailers, which hold parallel events (e.g. Target’s Deal Days and Chewy’s Blue Box Sale).
This year’s Amazon Prime Day results show successes throughout each stage of the purchase funnel. Growth in unit sales increased by 32% year-over-year (YoY), exceeding product views, which jumped 30% during the same period. The increase in product views indicates that consumers know what they want and are, therefore, browsing less before they buy. The 36% revenue growth YoY shows that shoppers are spending more on purchases than last year.
Categories like Grocery & Gourmet with high purchase frequency, broad assortment, low price points, and high customer loyalty, experienced the highest conversion rates (CVRs). These types of categories make less revenue on a product-by-product basis than categories like electronics with bigger ticket items.
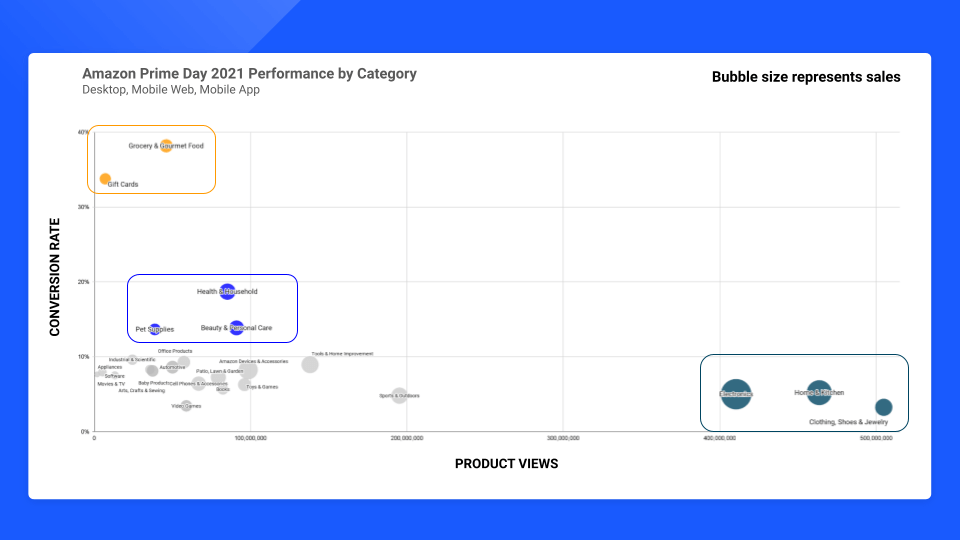
Categories with high purchase frequency and loyalty, broad assortment, and low price points had the highest CVRs
In our analysis of Amazon Prime Day results, we’ll start with lower-priced, high CVR categories and work our way up and go big with larger ticket items.
1. Grocery & Gourmet: Gum is sticky and growing
Growth was slow for Grocery & Gourmet. In fact, the unit sales lift – a measure of Prime Day relative to daily averages 20 days prior to Prime Day – was 8 percentage points (ppts) lower than last year.
On the other hand, purchases for the Chewing & Bubble Gum subcategory grew 97% YoY. That’s nearly twice the growth rate than that of its peers, indicating increased stickiness and successful penetration for Amazon’s grocery category as a whole.
However, we don’t suspect that discounts are fueling the revenue increase. After all, gum discounts aren’t too significant and sometimes don’t happen (e.g. Orbit Bubblemint Resealable bag stayed at $6.68 in the days leading up to and during the event).
So, what’s driving the revenue increase?
As shoppers buy bigger ticket items on amazon.com, they’re likely adding last-minute gum purchases to their virtual shopping carts.
Prior to COVID, gum was usually an in-store, impulse buy at checkout. Now the trend is shifting online and the Chewing & Bubble Gum category is a big beneficiary of Prime Day.
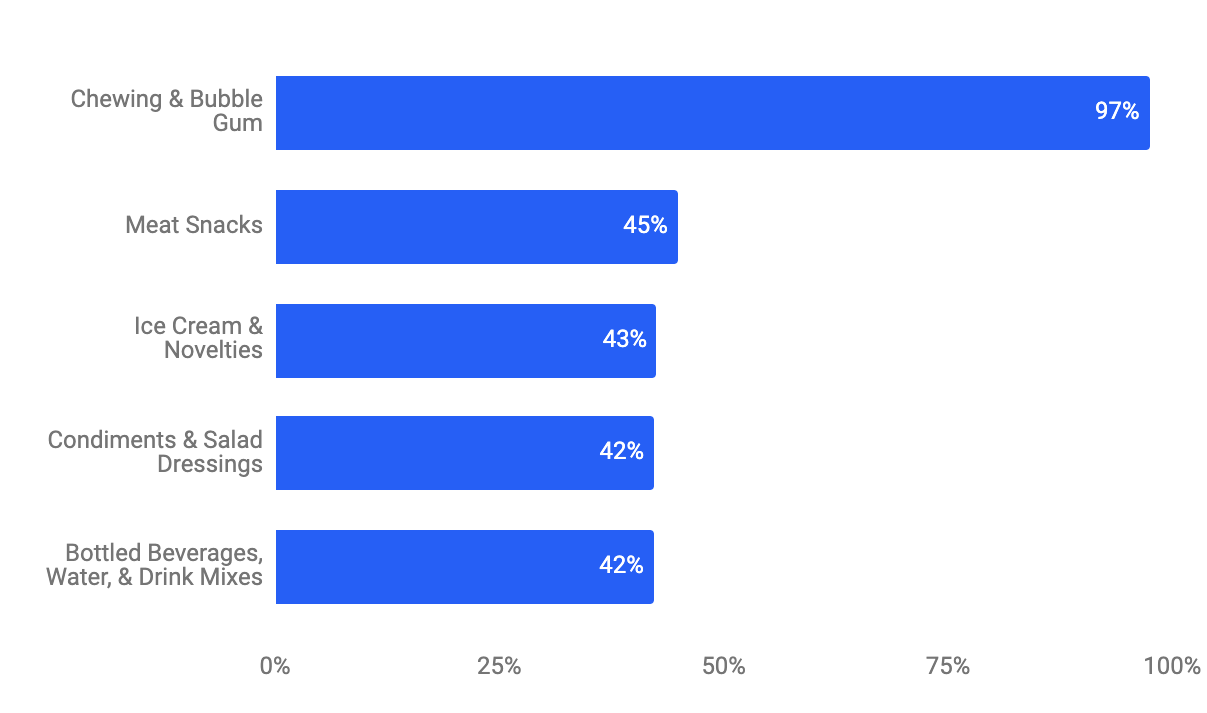
Amazon’s Chewing & Bubble Gum category grew 97% YoY on Prime Day
2. Health & Household: Cleaning tools clean up
Cleaning tools had the largest YoY growth for both the “Prime Day Lift” (+23.8%) and total unit sales (51.2%) within the Health & Household category. This growth was largely driven by increased sales in tools like O-Cedar and Swiffers. The lift in Prime Day sales for Household Cleaning was only up slightly (+2.3% YoY), but unit sales grew over 16%, indicating that consumers are less motivated by discounts but buying more cleaning products in general.
The lift for dishwashing products decreased 12.5%, the most of any subcategory, which can be attributed to the reopening of restaurants and more people dining outside the home.
3. Pet food: Brands barking up the right tree
Dog food brands during Prime Day 2021 saw sales increase a whopping 81% YoY. Prime Day unit sales were 2.6 times higher than the average unit sales of the previous 20 days. This is an increase from 1.5 times last year.
Top Pet Food Brands – Prime Day 2021 Unit Performance
Amazon.com, Unit Sales, Desktop, Mobile Web & Mobile App, Oct 13, 2020 vs. June 21, 2021
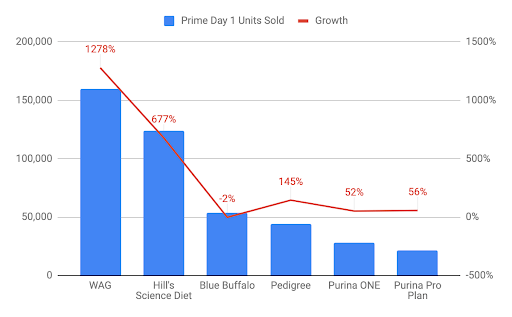
WAG, Amazon’s 1P brand, had the most YoY Prime Day growth in 2021
WAG saw the most growth in unit sales among pet food brands, increasing 13 times YoY. As a first party (1P) brand owned by Amazon, we suspect that this growth is related to Amazon putting more resources behind promoting it. Since it’s Amazon-owned, WAG products are influenced less by competitor sales than third-party (3P) brands. Consumers could not cross-shop WAG products on chewy.com during its Prime Day Blue Box sale – amazon.com is the only retail carrier.

Omega, this author’s pup, a big fan of jerky from WAG (+1278% sales growth), only available on amazon.com.
Hill’s Science Diet ranked second for growth in unit sales (+677% YoY). Blue Buffalo is the only brand to see a decline which could be related to shoppers choosing Hill’s brands instead – in May 2021, 10.6% of Blue Buffalo viewers cross-shopped Hill’s.
4. Vitamins & Supplements – Strong loyalty boosts Prime Day performance
With more than four million units sold over Prime Day 2021, Amazon’s Vitamins & Supplements sales grew 44% YoY. With returning customers making up 78% of users, sales primarily reflected those who already shopped on amazon.com, not new business – aligning with the category’s high Subscribe & Save rates.
Weight loss products had the highest share of new users (49%), reflecting limits to the duration of use for the product. Weight loss products, unlike other vitamins and supplements, which are taken nearly every day, are typically used for a few weeks or months, the duration of a diet. Many people begin diets at the start of summer. Plus, after a less active year, there is higher demand for these types of products.
New vs. Returning Users on Day 1 of Prime Day
Amazon.com, Desktop, Mobile Web & Mobile App, June 21, 2021
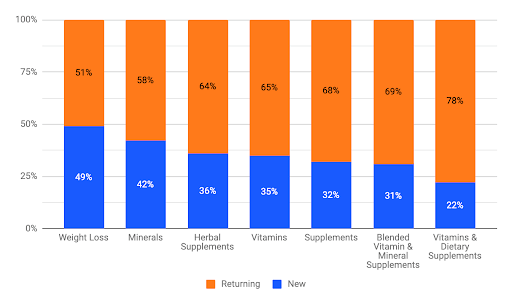
Weight loss products had the highest share of new users Prime Day 20201
5. Athletic apparel
As new customers turned to Amazon to lose weight, they purchased more athletic apparel to get fit. Sales grew significantly for the athletics apparel brands this year during the Prime Day event (+64%) and the lift (3x) exceeded 2020 (2.8x). Yoga clothing (+297% YoY) was the fastest-growing subcategory as social distancing measures relax and people shape up by returning to Yoga class.
6. Toys & Games: TeeTurtle trends on TikTock
Toys and Games unit sales increased slightly during Prime Day 2021 (+12% YoY), which was consistent with last year’s performance. Sports and Outdoors, which saw a +217% over the same period, was the fastest-growing subcategory, likely due to the early summer date of Prime Day.
LEGO continues to be the top-selling toy brand, increasing units sold by 51%on Prime Day (YoY). Magic: The Gathering saw unit sales soar +340% and TeeTurtle experienced a +179% increase in unit sales YoY, which is the most significant jump. TeeTurtle’s octopus plushie went viral on TikTock and received related press for going out of stock on amazon.com earlier in the year, likely driving even stronger performance.
7. Electronics purchases trend toward pricier consumer preferences
Known to offer deep discounts on Prime Day, this year, consumers were more willing to purchase more expensive electronics products from Amazon. Revenue growth outpaced units sold by nearly 10 ppts (27% vs. 37%) YoY, reflecting declining economic uncertainty, pandemic recovery, and higher purchase confidence levels.
Revenue for Samsung Electronics (+151%) and Samsung (+111%) grew the most, while Apple revenue declined by 20% YoY, driven predominantly by a decrease in Airpods sales. Last year, Apple AirPods with Charging Case (Wired), was the sixth best-selling product on Prime Day. This year “Airpods” did not even rank among the top 20 most-clicked keywords during the event.
To learn more about the data behind this article and what Similarweb has to offer, visit https://www.similarweb.com/.


Sign up to receive our stories in your inbox.
Data is changing the speed of business. Investors, Corporations, and Governments are buying new, differentiated data to gain visibility make better decisions. Don't fall behind. Let us help.


Sign up to receive our stories in your inbox.
Data is changing the speed of business. Investors, Corporations, and Governments are buying new, differentiated data to gain visibility make better decisions. Don't fall behind. Let us help.