

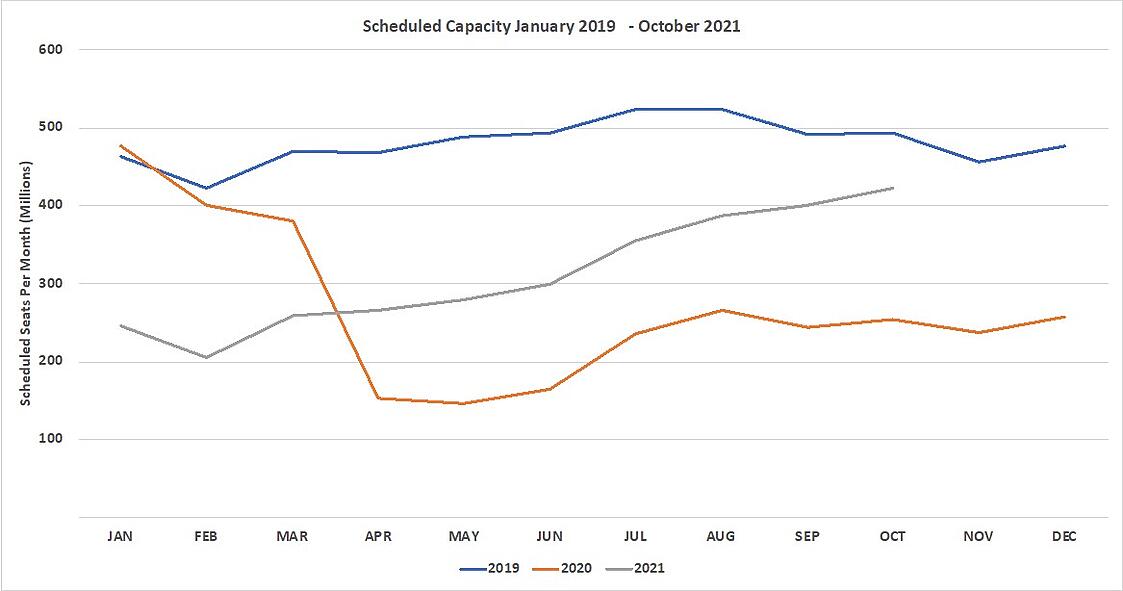
Global capacity once again slipped back week on week as everyone settles down for three weeks of Olympian TV coverage and governments around the world once again stop travel, adjust their traffic lights and threaten further restrictions in the next few weeks. Despite increasing vaccination rates around the globe, booking travel remains a gamble for everyone. This week’s 81.6 million is 1.3% down on last week’s numbers and remains 31% below the same week two years ago; this is normally the busiest week of the year, read into that what you will.
Airlines remain as nervous about the next few weeks as an athlete on the starting line in Tokyo dropping another 2.6 million seats in the last seven days for July and to the end of October removing another 27.2 million seats; those are not the actions of an industry confident of a recovery. Between July and October 2019, the Transatlantic market alone generated revenues of some US$10.6 Billion, we will be lucky if one tenth of that is realised two years later. Since this is the time of year when airlines stash the cash for the winter season the lack of urgency in reopening this market must worry many major legacy airlines.
Chart 1 – Scheduled Airline Capacity by Month
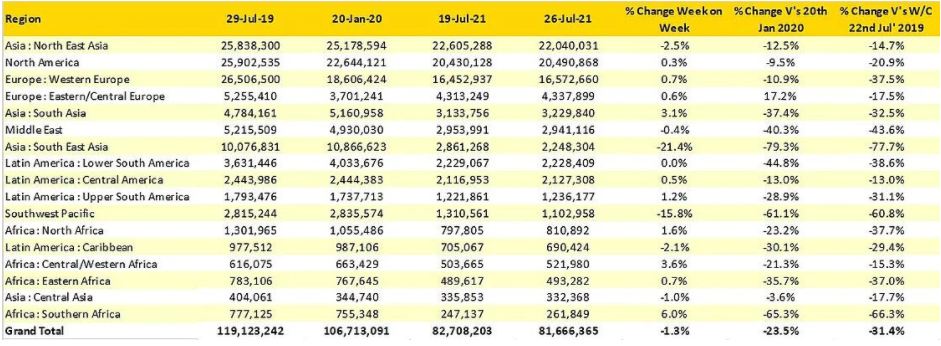
In previous weeks, we have seen at the regional market level some strong levels of growth - not this week, most markets are flat. In percentage terms, Southern Africa leads the way with growth of 6%, but that is only 15,000 more seats, whilst in absolute terms, Western Europe with another 120,00 seats is the winner although less than 1% growth; any way you look at the regional numbers the market is becalmed.
With the Tasman bubble once again bursting and at least a seven-week break in travel now in place it is no surprise that capacity in the Southwest Pacific has dropped by over 21% week-on-week. At its peak, the bubble reached the dizzy heights of 45,000 scheduled seats a week in both directions, and with Australian domestic capacity once again being cut certainly for the short-term the position looks very gloomy in that part of the world.
Whilst North East Asia remains the largest region in the world, it seems that Japan has decided to stay at home and watch the Olympics, with a 10% reduction in capacity week-on-week. In total the region has seen a near 600,000 reduction in weekly seats, China as always dominates the market (-352,000 seats) and indeed the Olympic medal table.
Table 1– Scheduled Airline Capacity by Region
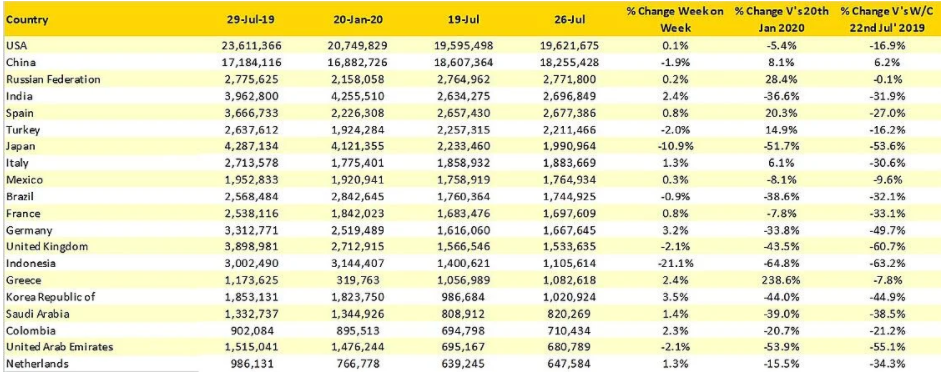
Capacity in Indonesia bounces around on an almost weekly basis with a further 21% drop in capacity this week. Travellers in the country remain desperate to fly as the gentleman who borrowed his wife’s clothes and passport last week to try and travel highlights the measures some people will go to for a cheap flight home.
Table 2- Scheduled Capacity, Top 20 Country Markets
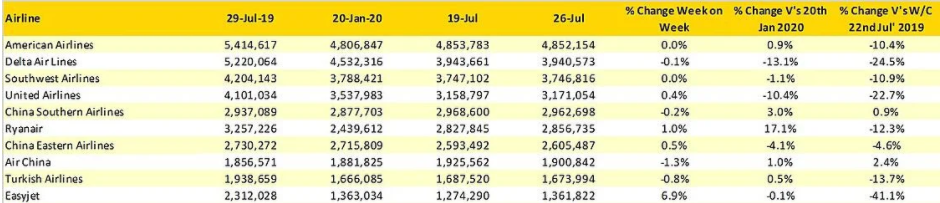
The biggest change of the week is that easyJet have jetted back into the top ten global airlines with a near 7% increase in capacity displacing Indigo; obviously good news for the Luton-based carrier but still 41% below their July 2019 capacity levels. Ryanair, who announced their latest earnings this morning, a modest loss for the quarter of £234 million but on the upside an expectation of doubling passengers carried from June to August; with yields remaining very soft having a cost advantage over others is a neat space to be in. If Ryanair’s results are anything to go by then some carriers will be losing significantly more in their quarterly trading updates, remember, Ryanair are traditionally one of the better performers.
Table 3- Top 10 Airlines
So, what does this week’s data tell us? Have we peaked? Is airline confidence once again spooked? Or have airline network planners gone on holiday? Probably a combination of all and more! Until some real positive breakthroughs come in major international markets such as China and the United States; these numbers are probably as good as it will get, if indeed they are good. For many carriers the hoped for recovery isn’t happening and that can only mean another winter of discontent for many.
To learn more about the data behind this article and what OAG has to offer, visit https://www.oag.com/.


Sign up to receive our stories in your inbox.
Data is changing the speed of business. Investors, Corporations, and Governments are buying new, differentiated data to gain visibility make better decisions. Don't fall behind. Let us help.


Sign up to receive our stories in your inbox.
Data is changing the speed of business. Investors, Corporations, and Governments are buying new, differentiated data to gain visibility make better decisions. Don't fall behind. Let us help.