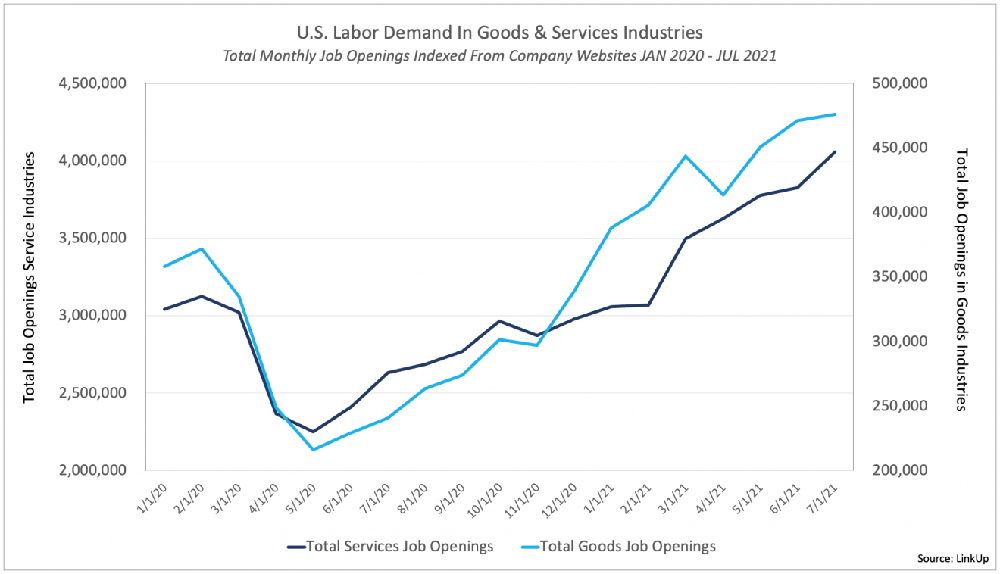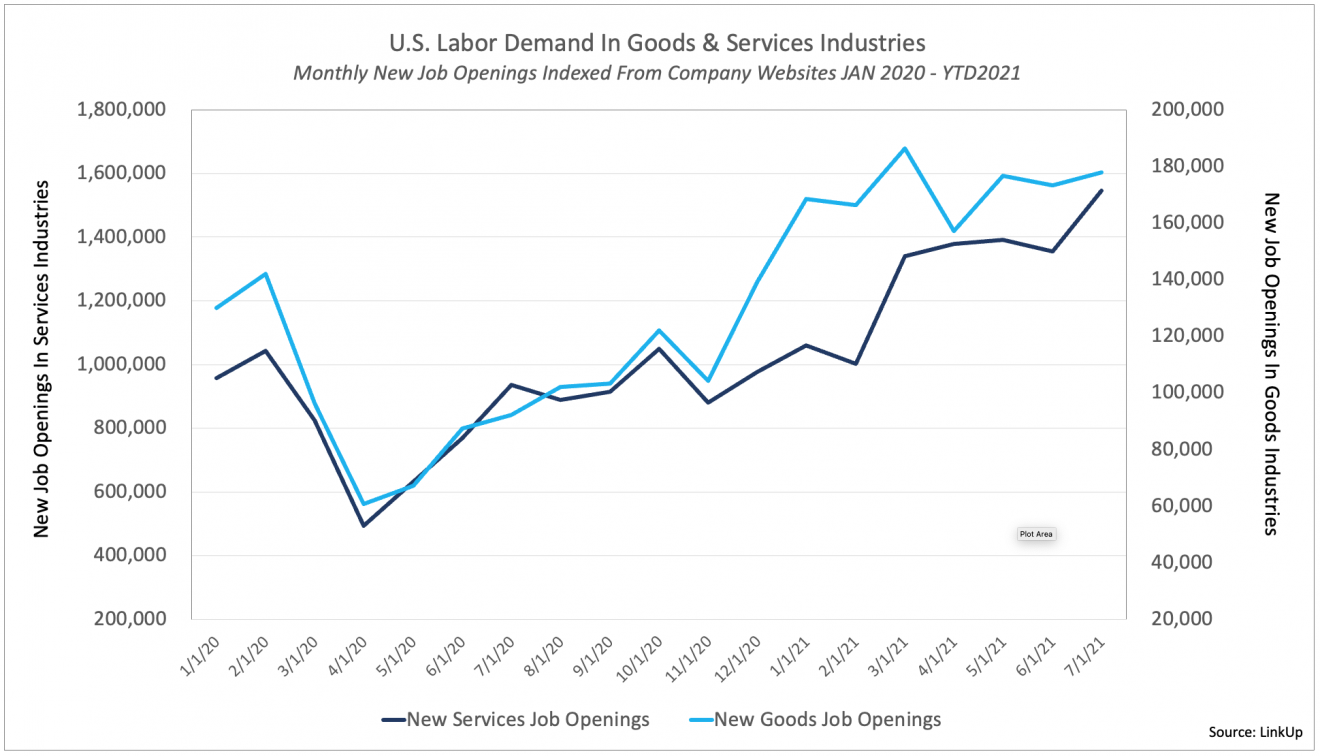
We’ll post updated charts later this week when we get our data for August, but we wanted to post the two charts below that show total (below) and new job openings (bottom) in goods and services industries between January 2020 and July 2021.
As the first chart below for total job openings shows, between May and November last year, labor demand in services industries rose faster immediately following the decimation of Q2 ’21 than goods-producing industries. But beginning last November, labor demand in goods-producing industries started outpacing labor demand in services industries. In fact, the former has risen 60% while the latter has risen just over 40%.
Dividing employers across the economy in the same way but looking just at new job openings provides some additional insights into labor demand since the pandemic began roughly 18 months ago. New job openings in goods and services industries tracked closely to each other between May and November of last year, but then diverged even more sharply than the previous chart.
Highly noteworthy, however, is that new job postings in goods industries have remained essentially flat since the first of the year. And in services industries, new job postings were flat between March and June of this year before jumping again in July.

To learn more about the data behind this article and what LinkUp has to offer, visit https://www.linkup.com/data/.


Sign up to receive our stories in your inbox.
Data is changing the speed of business. Investors, Corporations, and Governments are buying new, differentiated data to gain visibility make better decisions. Don't fall behind. Let us help.


Sign up to receive our stories in your inbox.
Data is changing the speed of business. Investors, Corporations, and Governments are buying new, differentiated data to gain visibility make better decisions. Don't fall behind. Let us help.


