
With the pandemic spurring more and more people to move into new, and often larger homes, outfitting these living spaces has become top-of-mind. However, with the rise of eCommerce, in-store furniture shopping has become passé – consumers are going digital instead.
To help brands and retailers navigate this changing landscape, we’ll analyze the digital performance of top online furniture sites, using our eCommerce solutions, Research and Shopper Intelligence. Get comfy as the battle between Wayfair vs. Overstock vs. Ikea vs. Amazon plays out and learn from their best practices so you can also succeed online.
Competition heats up: Consumers go online for furniture shopping
Trends across furniture retailers’ landscape and on amazon.com show a shift in consumer demand to online shopping.
Web traffic: Overstock vs. Wayfair vs. Ikea
In the past two years (since September 2019), combined web traffic to wayfair.com, overstock.com, and ikea.com increased 73%. Current and historical traffic to wayfair.com has exceeded that to overstock.com and ikea.com, which are in a much tighter race. Since January 2021, Overstock averaged 6M more monthly visits than Ikea. However, traffic to Ikea recently (August 2021) edged out Overstock.
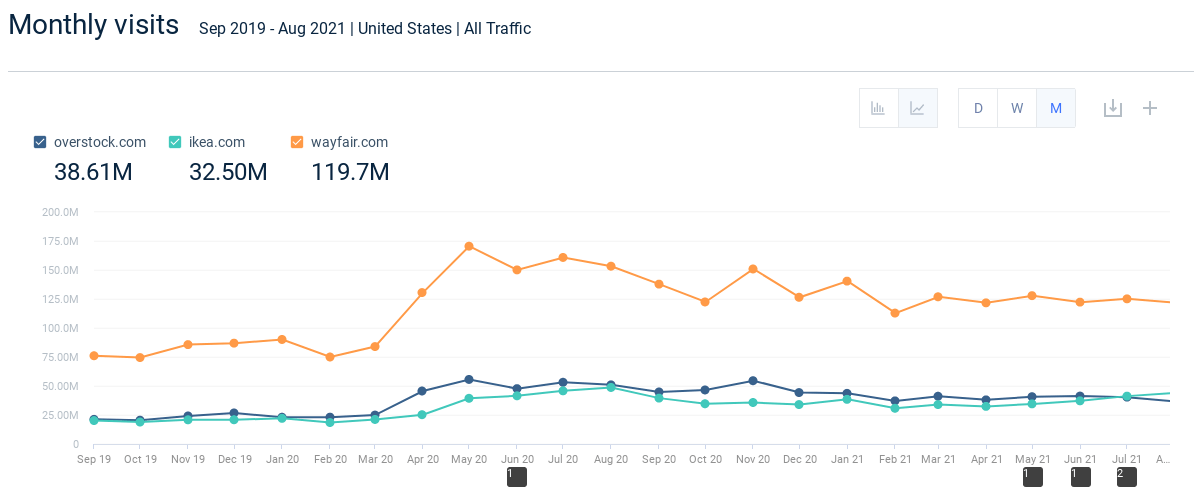
Traffic peaked to all retailers in May 2020, reflecting increased online furniture shopping at the height of COVID-19 and the desire to furnish larger spaces as the housing market boomed. In August of this year and last, traffic to Ikea appears to catch up to Overstock, perhaps due to its low cost, contemporary furniture being favored to outfit dorm rooms during back to school season. Yet, Overstock gains a lead into the holiday season.
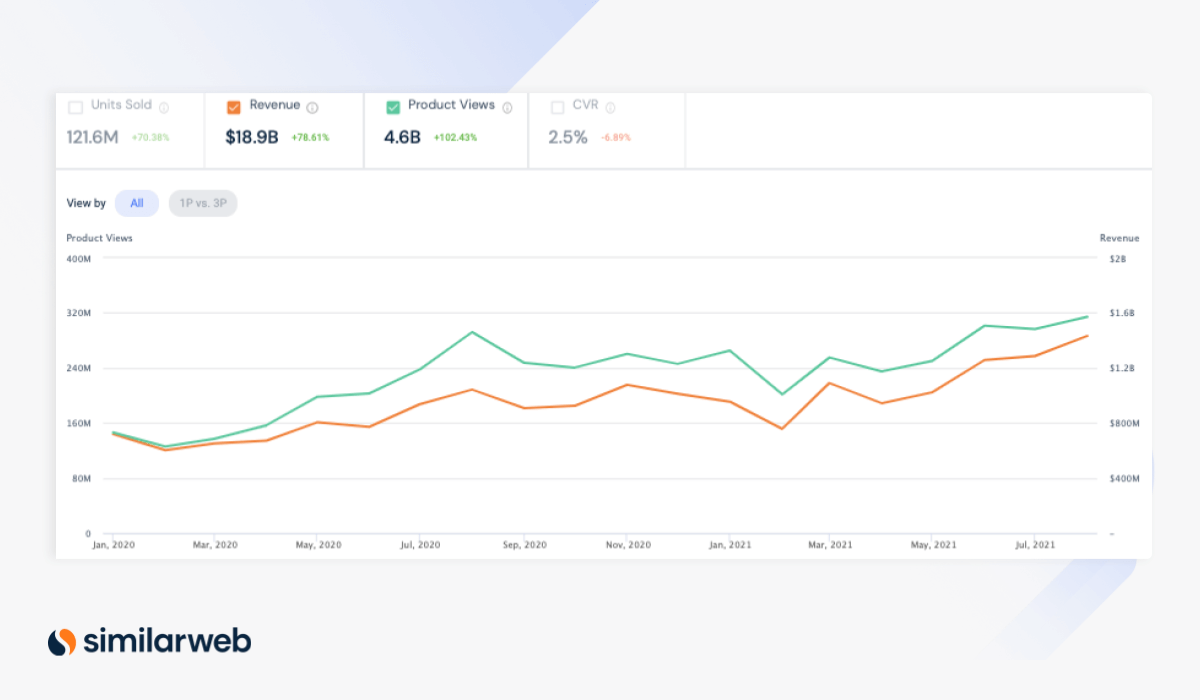
Amazon
Activity on leading eCommerce marketplaces, like Amazon, also reflects the growing online furniture industry. Product views for Amazon’s furniture category increased 103% January 2020 – August 2021, exceeding the average growth of other categories (+55%) during the same time period, showing furniture’s growth is stronger than in other sectors.
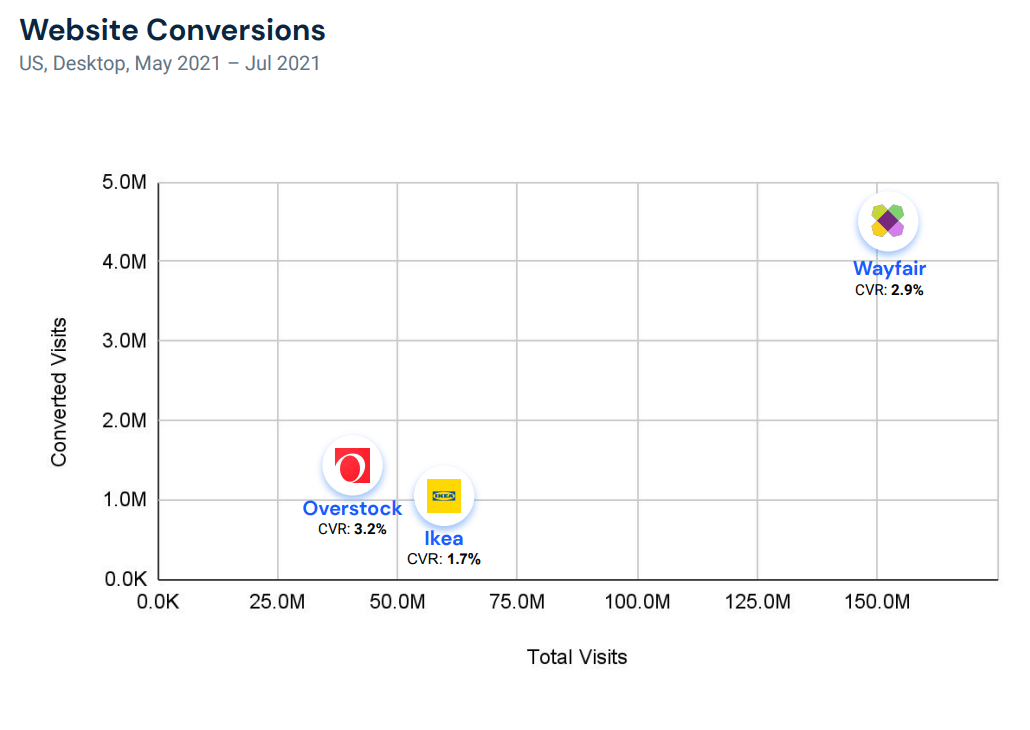
Conversion rates
At 3.1%, Overstock has the highest conversion rate (CVR) among the three furniture retail sites, surpassing Ikea’s 1.7% and Wayfair’s 2.9%. Its conversion rate also exceeds that of Amazon’s Furniture category which was 2.6% in July.
Ikea surpasses Overstock for the number of desktop visits, with 14.5M more desktop visits in the past three months. However, due to Overstock’s higher CVR, it converted 11.8X more visits than Ikea (1.4M vs. 118K) in this time frame. Despite a lower CVR, Wayfair’s number of converted visits still exceeds Overstock as it has much more overall traffic – 123 million monthly visits vs. Overstock’s 39.5 million.
The 16% decline in CVR for Amazon’s furniture category exceeds the average decline (-3.5%) across other Amazon categories January 2020 – July 2021. These metrics suggest that more and more consumers are cross-shopping other retailers before deciding to buy large ticket items, which may require more research before purchase than most Amazon items.
Low customer loyalty also contributes to these numbers. In August, just 38% of furniture shoppers were returning customers. Also, zero furniture revenue comes through Subscribe and Save, Amazon’s subscription program which guarantees recurring purchases. This number often exceeds 20% for categories like Grocery & Gourmet and Household, with essential, low-cost items.
Getting the right customers: Cross-shopping and audience loyalty
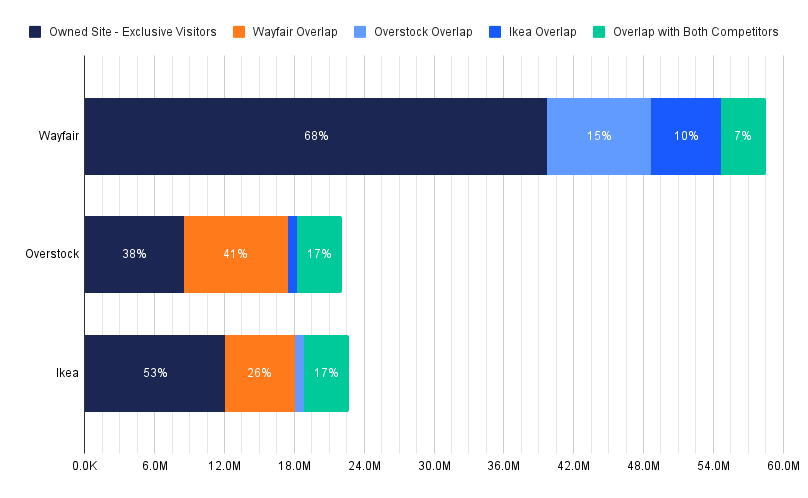
Shoppers on wayfair.com seem more loyal than those shopping on overstock.com or ikea.com. Only 33% of Wayfair shoppers visited these competitor sites. However, 47% of Ikea’s visitors and 61% of Overstock visited Wayfair, indicating that Wayfair is more effectively retaining traffic.
Audience Overlap between Top Furniture Retailers
U.S., Desktop, May 2021 – Jul 2021
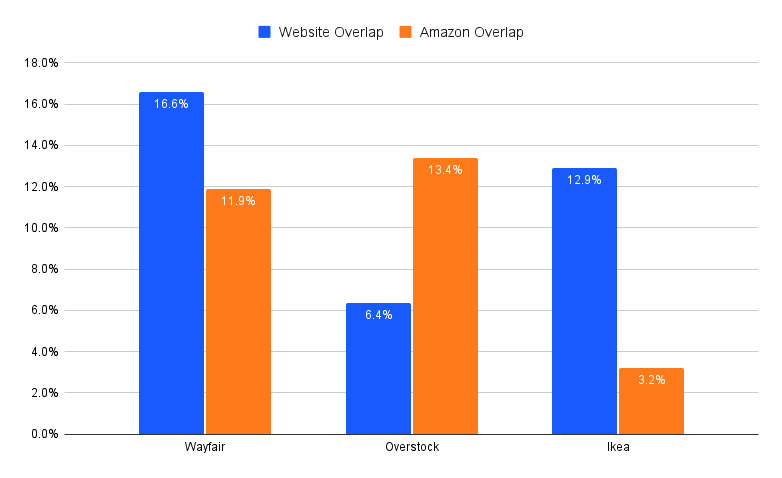
Wayfair also appears to be the largest threat to Amazon. Nearly 17% of Amazon furniture shoppers also visited Wayfair, whereas just under 12% of Wayfair shoppers visited Amazon.
Again, Overstock shoppers exhibit the least loyalty among the four retail sites – 13.4% of its shoppers visit amazon.com. With just 6.4% of Amazon shoppers also visiting Overstock, it appears to be a lesser concern for the eCommerce giant.
Shopper Overlap with Amazon Furniture
U.S., Desktop and Mobile, May – July 2021
Takeaway
Since Overstock has the highest share of traffic overlap among the measured furniture retailers (61%), it can work on opportunities to increase loyalty on the platform and better communicate its unique value proposition.
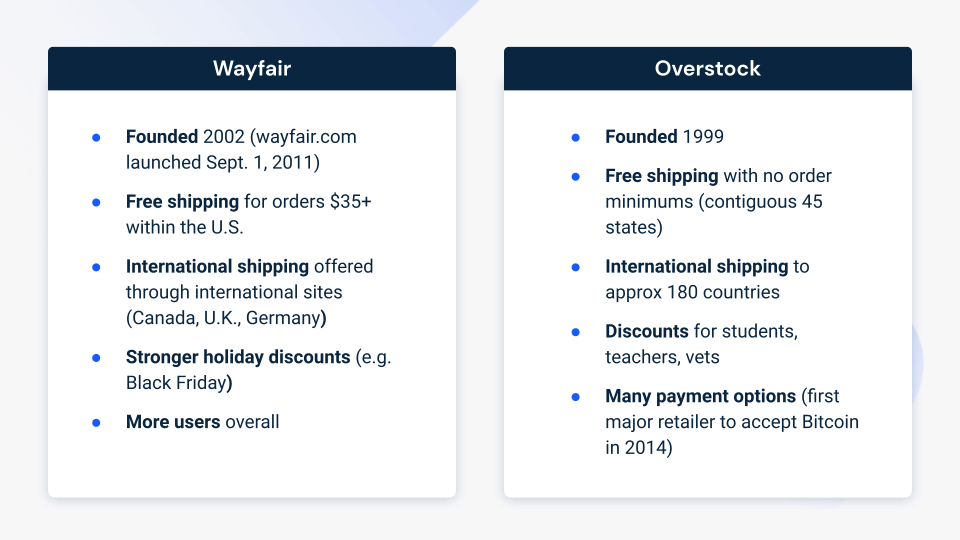
For instance, Overstock can highlight the ability to pay in various formats (Overstock has long accepted Bitcoin and has been a leader in the cryptocurrency space), its more flexible return policy, and discounts offered to veterans, teachers, and students. It can also highlight its growing number of private label brands, which it initially pushed to compete with Wayfair, and, of course, are only available on Overstock’s website.
Overstock capitalizes on mobile traffic
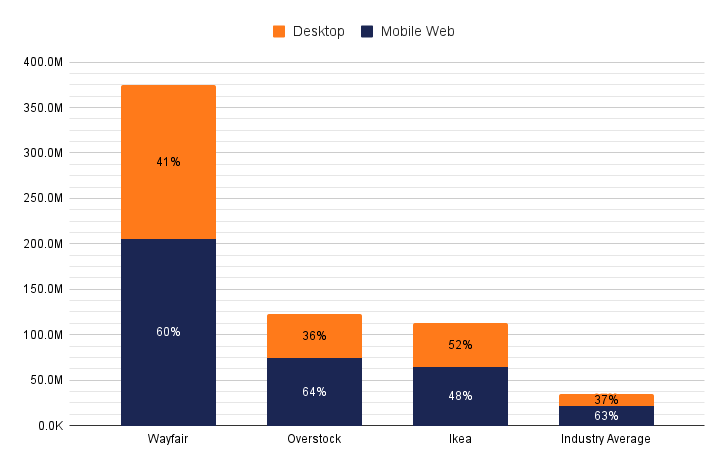
Overstock’s breakdown of mobile vs. desktop traffic most closely resembles device usage across the furniture industry. Overstock generates 64% of traffic through mobile devices whereas Wayfair generates 60% and Ikea generates just 48%.
The proportion of mobile traffic to overstock.com exceeds that which goes to the top 25 furniture websites (63%) but lags the top 100 in the furniture industry, according to Research Intelligence data. Mobile devices accounted for 69% of traffic to the top 100 furniture retail websites in recent months (May – Aug. 2021).
Site Visits by Device Distribution
U.S., Desktop and Mobile Web, May 2021 – Jun 2021
We suspect that a larger proportion of the top 25 sites started as brick-and-mortar stores vs. the top 100, contributing to the 6 percentage point (ppt) difference. For instance, Ashley Furniture, Crate and Barrel, and Mattress Firm, ranked among the top 10, started with onsite businesses like Ikea. Digging deeper into the list, more D2C brands like Nectar, Casper (leaders in mattress wars), and Joybird appear, which started purely as online businesses. Therefore, optimization across devices – their only “storefronts” – was likely of higher priority than retailers with physical storefronts as their initial, core business.
As mobile-savvy millennials and Gen Zers up their buying power, we anticipate the furniture industry to continue to go more mobile. The competitive set needs to make sure that their sites are optimized for mobile. Wayfair and Ikea can even look at Overstock’s mobile growth and emulate best practices.
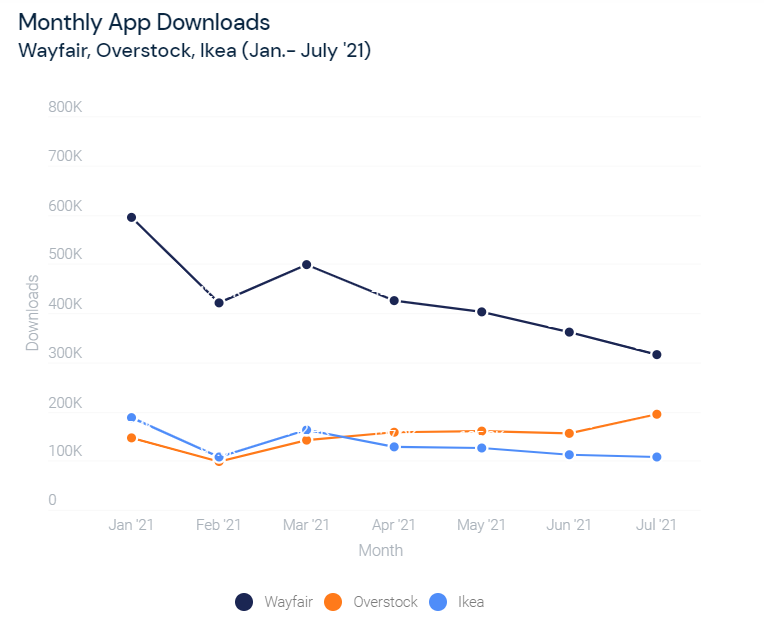
App downloads: Overstock is catching up to Wayfair
App download trends suggest that Overstock is catching up to Wayfair. While Wayfair has an overall larger mobile audience, its app downloads in July were at a year-to-date (YTD) low of 314.7K. At the same time, Overstock’s monthly app downloads reached a peak at 193.8K.
Moreover, Wayfair’s daily active users (DAU), at 207K in July, has been decreasing 9% month-over-month (MoM) since April, whereas Overstock has remained stable at around 37K.
Takeaway
Overstock’s increased downloads suggest it’s successfully marketing and building brand awareness of its app. To capitalize on this, to boost engagement and app usage, Overstock could send more push notifications about promotions and events.
Search trends to watch
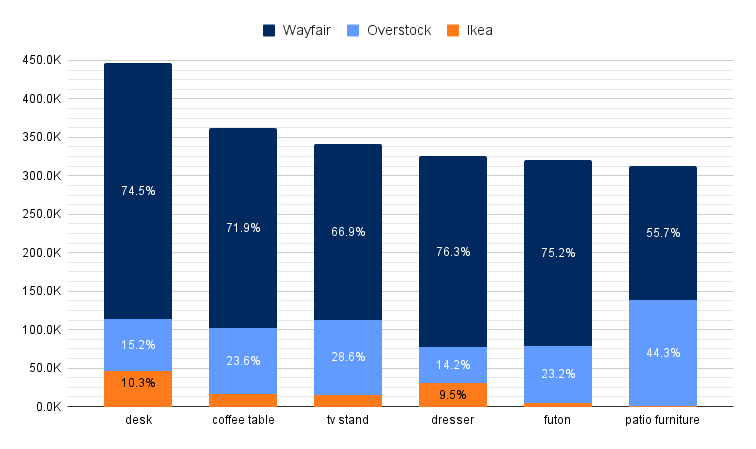
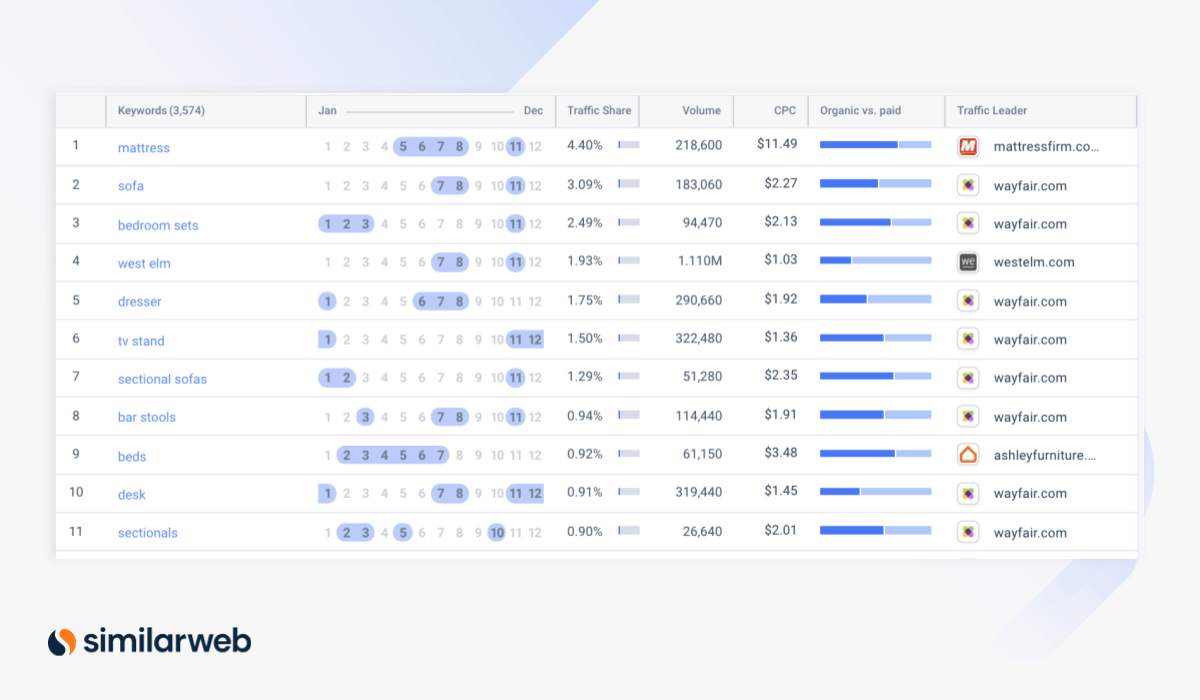
Currently, Wayfair captures an average of 70% of mobile traffic from top search terms. However, there are some areas in which other furniture retailers con focus to help gain traction, including:
Work from home: Desk is the most common search term, driving 447K visits to the competitive set. It also was the second-most searched term across Amazon this summer (behind Crocs).
With the continued prevalence of remote working and the recent back-to-school season, the prominence of not only desk, but related searches is likely to continue.
Although Wayfair already dominates for the desk search term, retailers and brands may want to work on optimizing their product listings and investing in PPC for related, but relevant terms. For instance on amazon.com, computer desk and standing desk rank among the top twenty most searched terms. Office furniture like office chair rank among the top five.
Seasonal furniture: Overstock received 44% of traffic from patio furniture and 50% of traffic for outdoor furniture, which is neck-and-neck with Wayfair, at 56% and 48% respectively, for these two similar terms popular in the summer months.
However, with summer ending and weather beginning to get colder, SEO strategies and PPC spend should shift toward terms related to indoor products. This may include dining room related terms, like dining table and dining room sets, among the top 10 trending furniture industry terms for August, reflecting shifting consumer demand to entertain indoors, particularly with the upcoming winter holidays.
Pro-tip: Use the Keyword Seasonality feature of Research Intelligence to identify relevant keywords for the furniture industry and when they are trending to adjust budget accordingly.
Final thoughts
While Wayfair is clearly the leader among online furniture retailers, Overstock is a commendable runner-up, due to its higher CVR, strong traffic share in mobile web, and increasing downloads of its app. To help maintain its prominent position in the furniture industry, Wayfair should observe Overstock’s online strategies.
Additionally, all furniture retailers and brands can leverage eCommerce tools to gain digital intelligence to improve their online strategy. This may include Similarweb Research Intelligence, which provides a full understanding of the competitive online retail landscape, and Shopper Intelligence, which helps understand purchase and consumer behaviors across Amazon and online marketplaces.
To learn more about the data behind this article and what Similarweb has to offer, visit https://www.similarweb.com/.


Sign up to receive our stories in your inbox.
Data is changing the speed of business. Investors, Corporations, and Governments are buying new, differentiated data to gain visibility make better decisions. Don't fall behind. Let us help.


Sign up to receive our stories in your inbox.
Data is changing the speed of business. Investors, Corporations, and Governments are buying new, differentiated data to gain visibility make better decisions. Don't fall behind. Let us help.