
Introduction
Welcome to the December Apartment List National Rent Report. Our national index increased by 0.1 percent during the month of November, the lowest month-over-month growth rate of 2021. The pace of rent growth has been cooling rapidly for the past few months, but growth is still outpacing pre-pandemic trends, with the slight uptick this month coming at a time of year when seasonality normally causes prices to dip. Since January of this year, the national median rent has increased by a staggering 17.8 percent. To put that in context, rent growth from January to November averaged just 2.6 percent in the pre-pandemic years from 2017-2019.
While our national index was essentially flat, 53 of the nation’s 100 largest cities saw rents fall this month, indicating a widespread rental market cooldown. In particular, Boise saw the nation’s sharpest rent decline for the second straight month, with prices down 3.7 percent from October to November. Prices also fell sharply this month in San Francisco (-2.7 percent), one of the few cities where rents remain below pre-pandemic levels. With our national vacancy index ticking up for the third straight month, the rental market seems to be turning a corner from the unprecedented rent growth that has characterized most of this year.
Rents growth continues to taper off
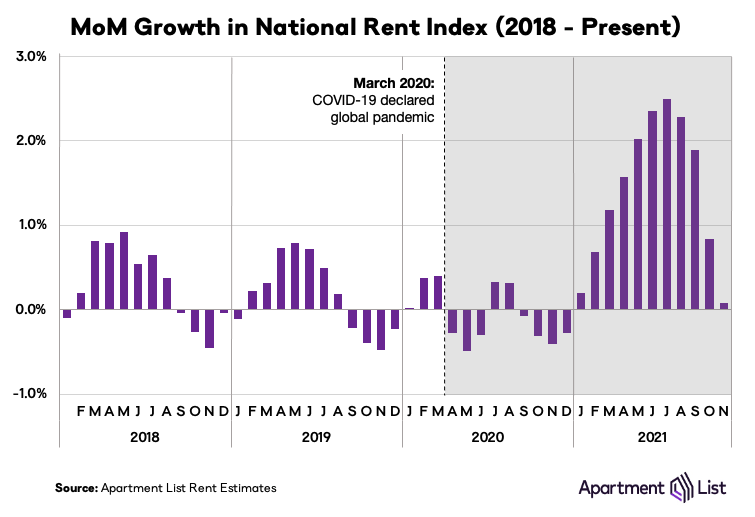
Rents grew by 0.1 percent this month nationally, the fourth straight month that growth has slowed after peaking at 2.7 percent in July. This represents the smallest month-over-month growth rate that we’ve recorded in 2021. A slowdown in rent growth during the fall and winter is typical due to seasonality in this market, but this year the seasonal slowdown is capping a year that has been characterized by unprecedented price increases. For seven months from March through September, month-over-month rent growth exceeded the pre-pandemic record going back to 2017. And while this month’s growth rate was essentially flat, it’s worth noting that we normally see rent prices decline in November. In the pre-pandemic years from 2017-2019, rents fell by an average of 0.5% from October to November.
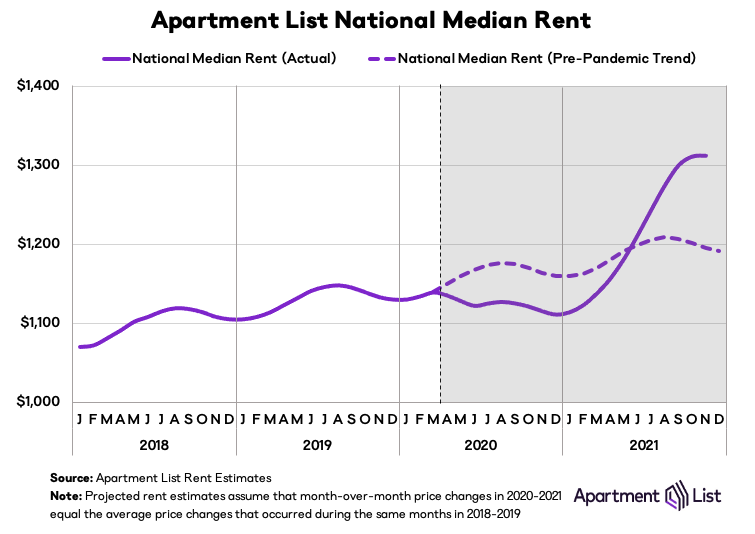
In other words, despite a significant slowdown, rent growth is continuing to exceed its pre-pandemic trend. To make this more clear, the chart below plots our national median rent estimate against a projection of pre-pandemic rent growth. The national median rent is $1,312 this month, which is $117 greater than where we project it would be if rent growth over the past year and a half had been in line with the growth rates we saw in 2018 and 2019.
Rents fell this month in 53 of 100 largest cities
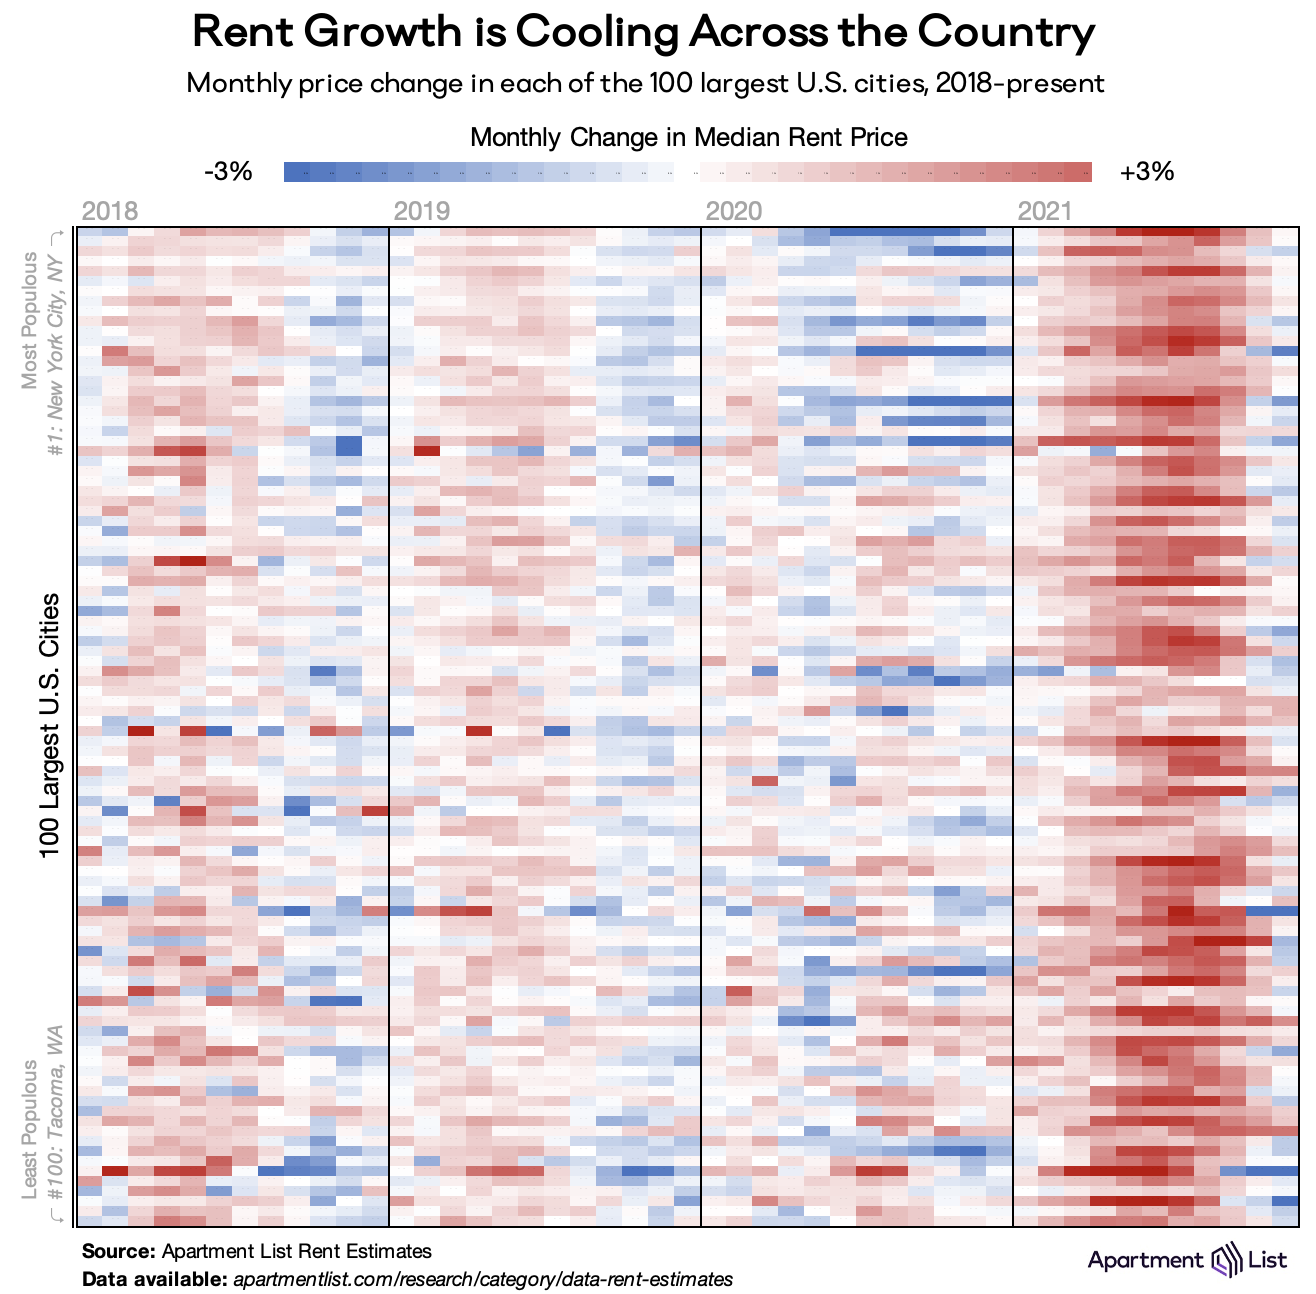
From March through September, virtually all of the nation’s 100 largest cities experienced rapid and uninterrupted rent growth. This can be seen in the chart below, which visualizes monthly rent changes in each of the nation’s 100 largest cities from January 2018 to present. The color in each cell represents the extent to which prices went up (red) or down (blue) in a given city in a given month. The dark red band on the right side of the chart depicts this year’s rent boom, but the final two columns show that the recent cooldown has also been geographically widespread. 78 of the 100 largest cities in the U.S. have seen rent growth slow down for two straight months. And 53 of these cities actually saw rents fall in November, the most since the previous November, when rents fell in 62 of the 100 largest cities. For pre-pandemic context, rents declined in 78 of these cities in November 2019.
Among the cities where prices have started their winter cooldown, many are expensive coastal markets that saw steep rent drops in 2020 and fast rent rebounds in 2021. In particular, rents fell by 2.7 percent this month in San Francisco, the city’s second straight monthly decline and the fourth largest decline in the nation. Prices also fell by more than 1 percent in nearby San Jose and Oakland, indicating that Bay Area rents have ended their rebound and could be entering another period of softness.
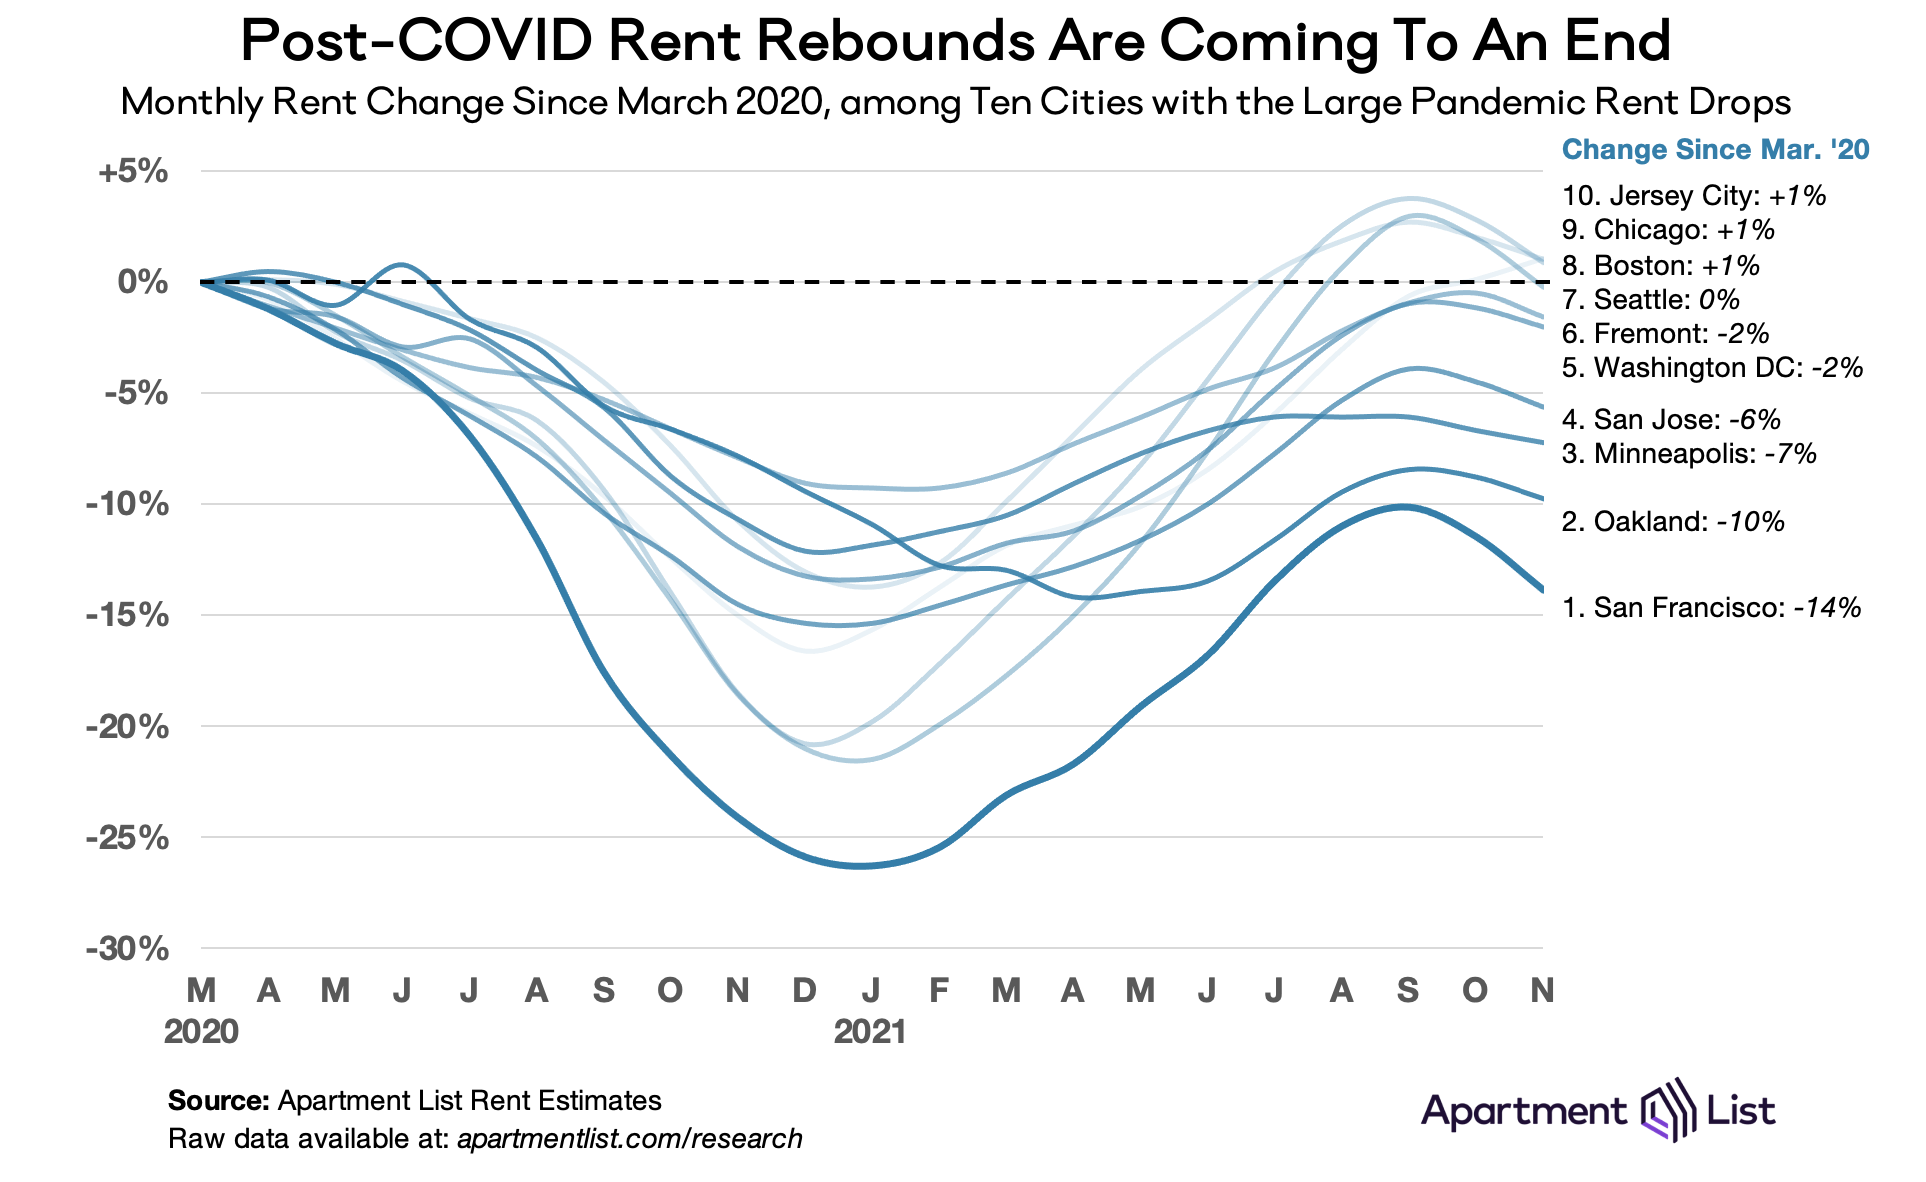
Rents have also dropped in consecutive months in Minneapolis, MN; Boston, MA; Seattle, WA; and Arlington, VA; all cities that experienced significant “pandemic pricing” discounts during 2020. This marks the end of a strong rebound period for these cities, as visualized in the chart below which contains rent trends since March 2020 for the 10 cities that saw the sharpest rent declines in 2020. Of particular note, this month’s 2.1 percent decline in Seattle has brought that city’s median rent back just below its pre-pandemic level. And even for the cities on this list where rents remain above their March 2020 levels, this month’s data could be a sign that growth will continue to lag the national average going forward.
On the other end of the spectrum, rent growth is also slowing in the cities that saw dramatic rent increases throughout the pandemic. Among the 10 cities with the largest rent spikes since March 2020, six saw prices dip this month, and only one – North Las Vegas – experienced an increase of more than 1 percent. North Las Vegas now occupies the top spot for fastest pandemic-era rent growth, with prices there up by 38% since March 2020.
Notably, Boise, ID is no longer among the top 10 for rent growth since March 2020. Rents in Boise fell by 3.7 percent this month, the second straight month in which Boise experienced the nation’s sharpest decline. Even after this sharp dip, rents in Boise are still 32 percent higher than they were before the pandemic. While this represents a staggering disruption to Boise’s rental market, the recent declines could indicate that the boom in demand may ultimately turn out to be a temporary one.
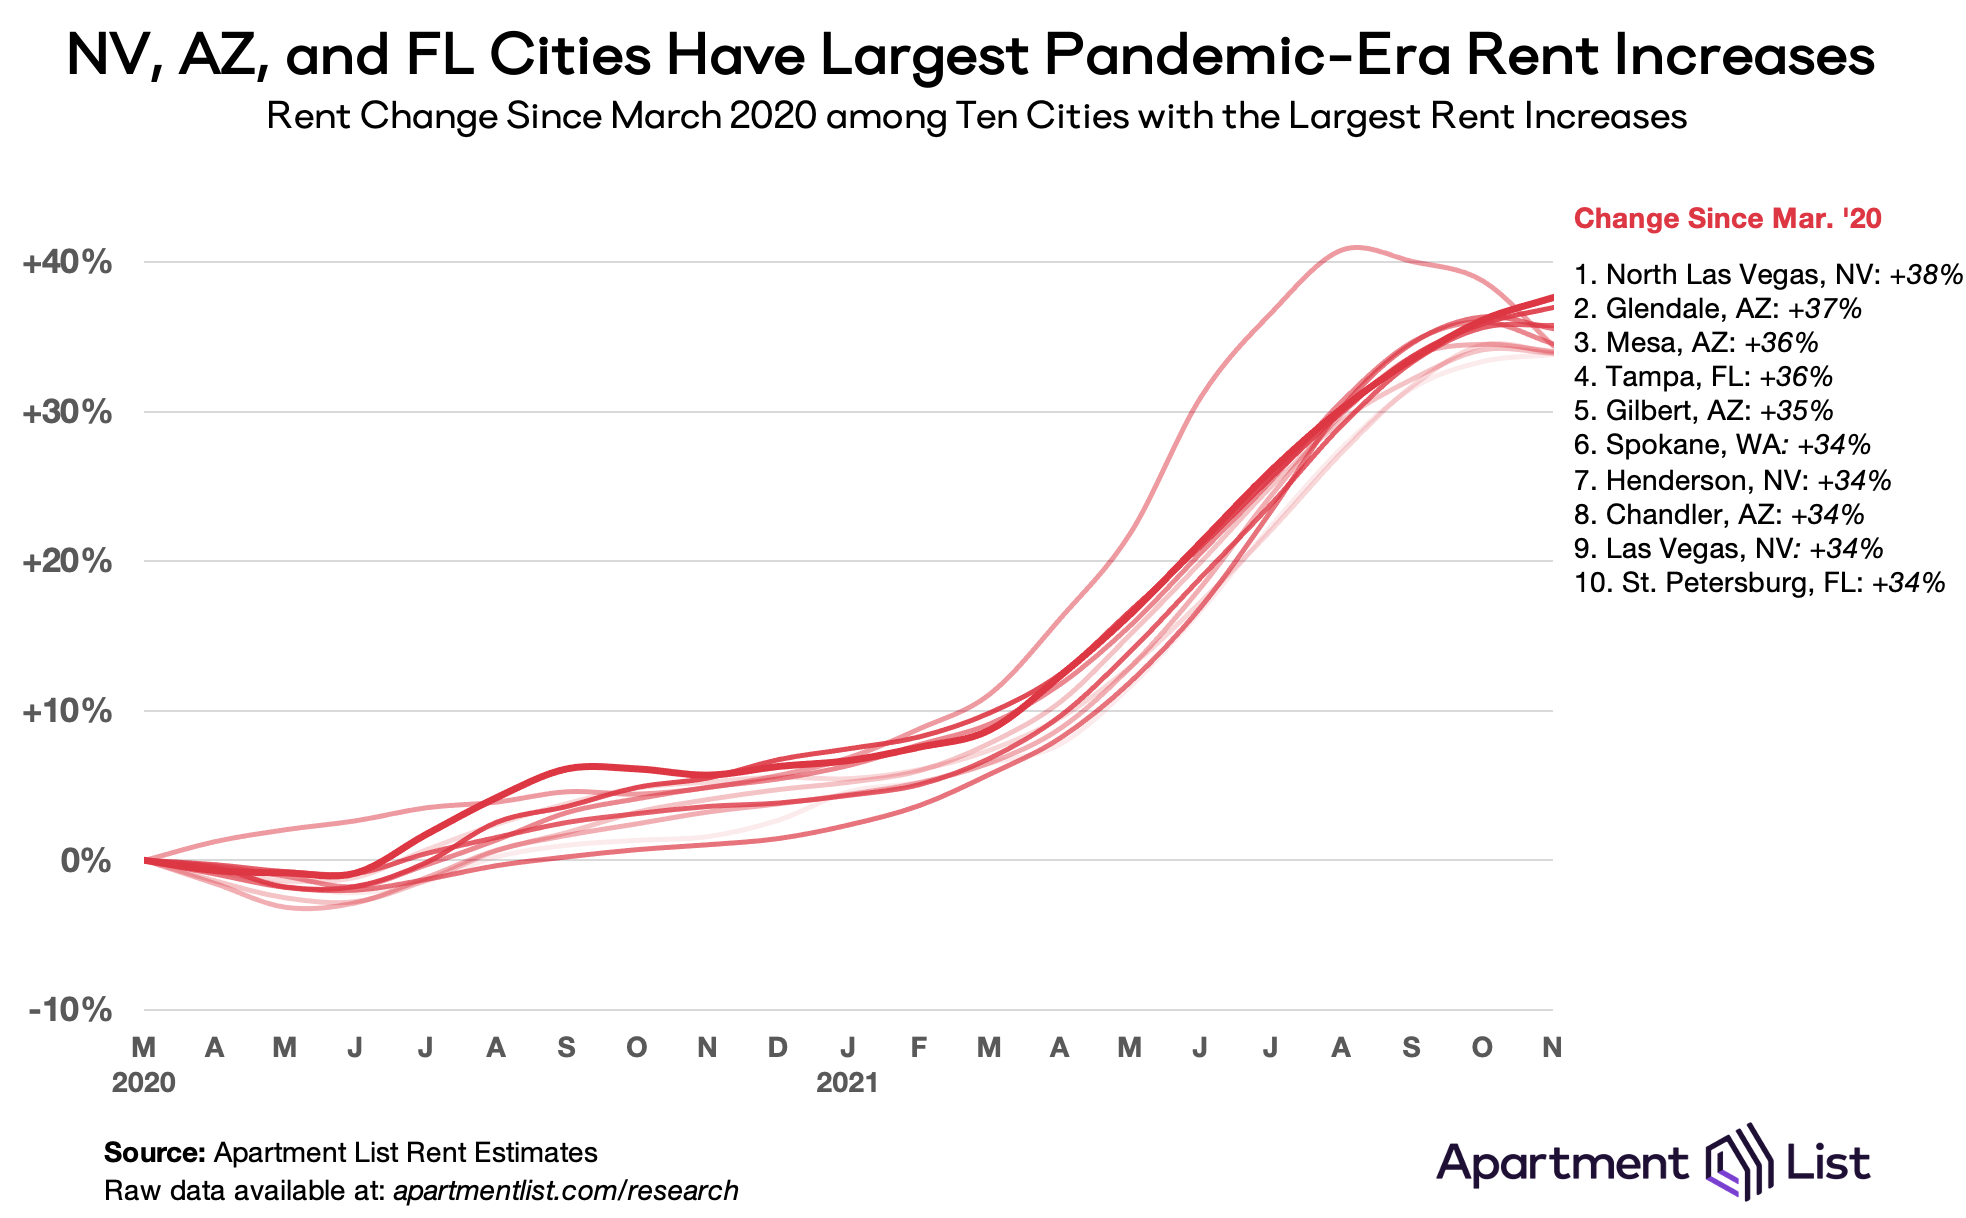
Although growth is tapering off, the ten cities in the chart above have all seen rents climb by 34 percent or more since the start of the pandemic. And nine of these booming markets are concentrated in just three Sun Belt metros – Tampa, Phoenix, and Las Vegas. In these markets the pandemic did not start a new trend, so much as accelerate an existing one. Affordability here was waning even before the pandemic ignited a rush of new rental demand. For example, from 2017 through 2019, rents in Mesa, AZ increased 25.5 percent, the fastest growth in the nation over that period. Although seasonality seems to be bringing some modest relief, rapid rent growth is continuing to pose a threat to housing affordability across the Sun Belt.
Vacancy rate ticks up for third straight month
As we’ve explored in detail, much of this year’s boom in rent prices can be attributed to a tight market in which more households are competing for fewer vacant units. Our vacancy index spiked from 6.2 percent to 7.1 percent last April, as many Americans moved in with family or friends amid the uncertainty and economic disruption of the pandemic’s onset. After that, however, vacancies began a steady decline, eventually falling below 4 percent.
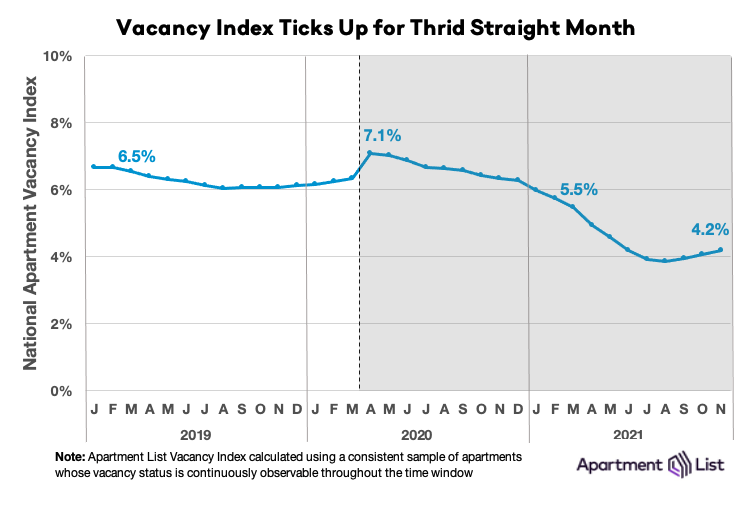
But after bottoming out at 3.8 percent in August, our vacancy index has ticked up slightly for three consecutive months and now stands at 4.2 percent. Although the recent increase has been modest and gradual, it represents an important inflection point, signalling that tightness in the rental market is finally beginning to ease. If our vacancy rate continues to increase in the coming months, it’s likely that rent growth will also continue to cool.
Conclusion
Although the pandemic created some softness in the rental market last year, 2021 has brought the fastest rent growth we have on record in our data. Nationally, and in nearly all individual cities across the country, rent growth in 2021 has exceeded average growth rates from pre-pandemic years. But over the past two months that record-setting growth has finally shown signs of a meaningful slowdown. Although growth still exceeds pre-pandemic trends, our vacancy index ticked up for a third straight month and month-over-month rent growth was essentially flat. The market remains extremely tight, but we’ve now seen continued signs of that pressure gradually beginning to ease. That said, it’s important to bear in mind that 36 of the nation’s 100 largest cities have seen rents jump by more than 20 percent since the start of the pandemic. Even if rent growth is finally cooling, this year’s rent boom has already burdened many American renters with significant new housing affordability woes.
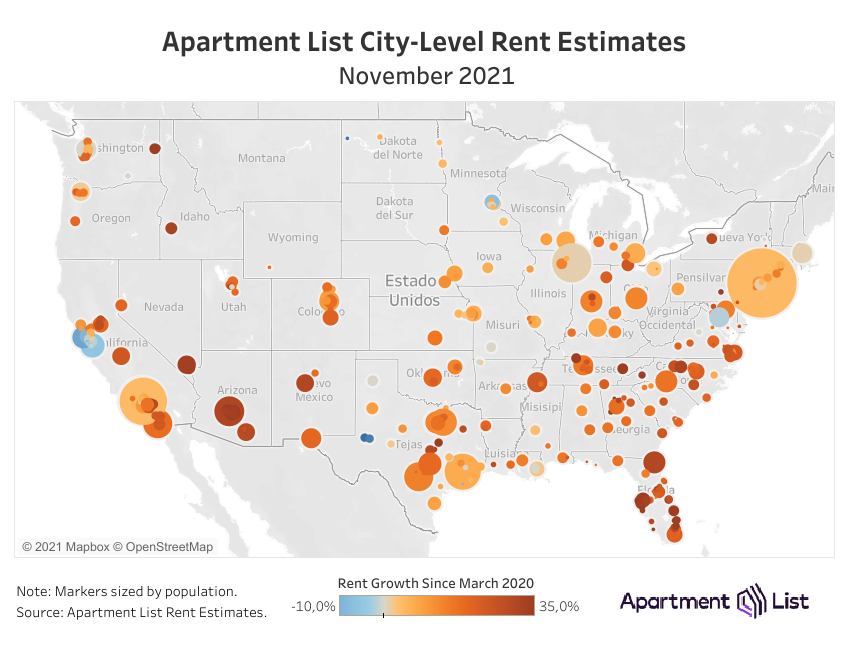
For complete data, explore the interactive map below or head over to our rental data page, where you can download the most recent estimates for your city, as well as historic data going back to 2017. And as always, feel free to contact us with any questions!
To learn more about the data behind this article and what Apartment List has to offer, visit https://www.apartmentlist.com/.


Sign up to receive our stories in your inbox.
Data is changing the speed of business. Investors, Corporations, and Governments are buying new, differentiated data to gain visibility make better decisions. Don't fall behind. Let us help.


Sign up to receive our stories in your inbox.
Data is changing the speed of business. Investors, Corporations, and Governments are buying new, differentiated data to gain visibility make better decisions. Don't fall behind. Let us help.