
As we approach the end of the year, we’ll be covering trends from 22 key markets. We’ll recap what each industry has experienced over the past year and what to watch for in 2022. Learn who are the top advertisers from each category and how they spend across formats.
Home is where the heart is. And where you now spend most of your time.
With so much time spent at home, Americans were more willing than ever to remodel their homes, invest in higher-end furniture and keep it clean.
Americans spent a record amount on home improvement in 2020, even though the U.S. economy shrank by 3.5%. This pace isn’t slowing down. “Homeowner improvement and maintenance spending are set to accelerate in the second half of [2021] and remain elevated through mid-year 2022,” said the most recent report released last month by the Remodeling Futures Program at the Joint Center for Housing Studies of Harvard University.
Americans want a lovely living environment. Others wanted to improve their home in order to take advantage of the blazing hot real estate market.
Either way they spent more on home goods in spite of growing prices.
The industry faces a trade labor shortage due to a wave of retiring baby boomers and a low number of young new entrants. On top of the labor shortage, the now infamous supply chain issues are impacting the number of goods imported to the U.S.
Americans spent $100 million less on imported goods in 2020 than they did in 2018. To offset this spending, they spent more on more expensive American-made goods.
Strong growth is expected next year. Which brands will be investing most in advertising to take advantage of this upswing in their market?
MediaRadar Insights
Overall Spending and Breakdown Across Formats
Overall, spend in the Home Goods category is up 12% YoY (January – October, 2021 vs 2020).
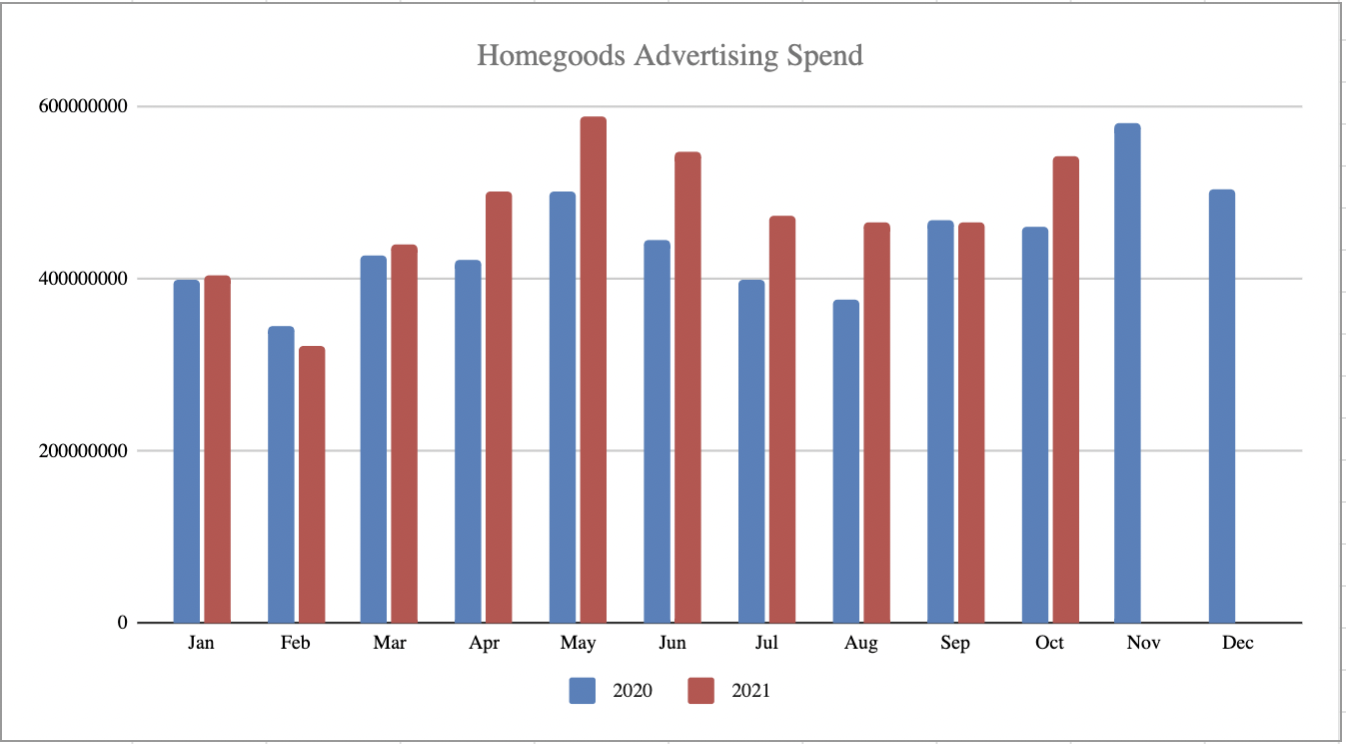
We see the largest increase in digital advertising, which grew 89% year-over-year, reaching $1.2 billion. Print and television advertising spend remained fairly flat.
Advertisers spent $2.5 billion on TV advertising. Print is approaching the billion mark, coming in at $991 million by the end of October.
Number of Advertisers
About 20 thousand advertisers spent $4.7 billion in 2021, compared to 20 thousand advertisers who spent $4.2 billion in 2020.
Advertiser Retention
In the top 22 advertisers in 2020, 13 advertisers remained top advertisers in the category. This is a retention rate of 59% in top advertisers.
In the overall category, the retention rate in the Home Goods category was 48%.
5 Top Advertisers – Which Advertisers Spent the Most in 2021?
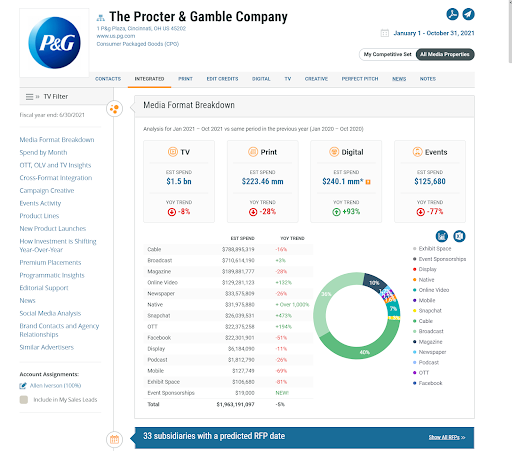
1. The Procter & Gamble Company
The Procter and Gamble Company spent heavily in the home goods category in 2021. They spent over $1 billion, amounting to 56% of their total spend.
Their digital investment is up over 93% to approx $240 million year-over-year. Spending on both TV and Print is down. TV spend is down 8% to $1.5 billion and their print spend is down 28% to over $223 milion. Formats that are up include Broadcast, Online Video, Snapchat, Native and OTT.
Below is a breakdown of Procter & Gamble’s ad spend thus far in 2021. We predict they will likely have 33 upcoming RFPs issued, MediaRadar can help you connect with 194 key contacts at P&G.
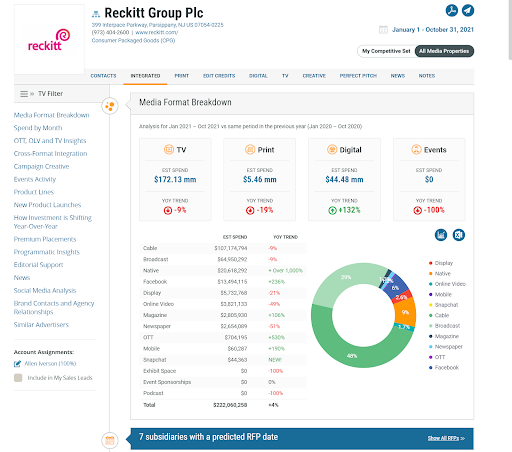
2. Reckitt Group Plc
Reckitt Group is a top advertiser in this category, dedicating 69% of their overall budget focused on ads promoting their home goods products.
Reckitt’s ad spend is up 4% in comparison to last year with their investment in digital up over 132% YoY. They have made significant investments in native and OTT ads. Over $20 million was allocated to OTT ads. Over $172 million dollars went towards TV spots, while over $44 million was placed in digital.
Below is a breakdown of Reckitt’s ad spend thus far in 2021. We predict they will likely have 7 upcoming RFPs issued, MediaRadar can help you connect with 54 key contacts at Reckitt.
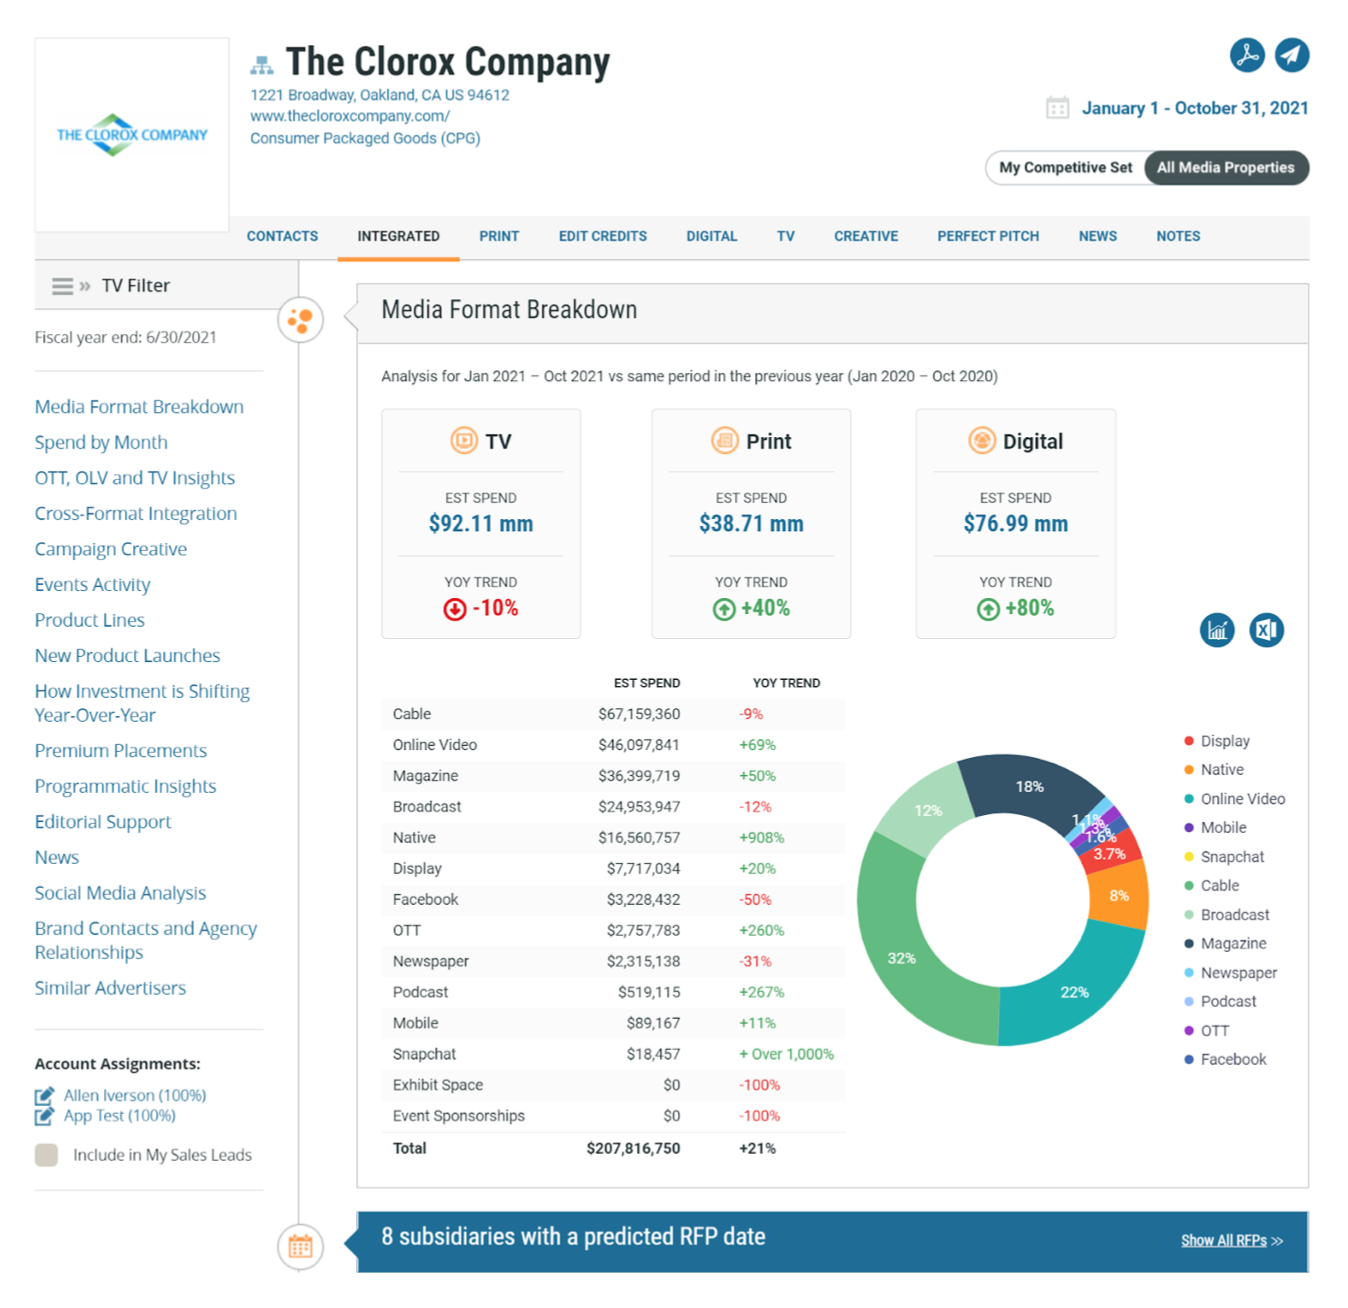
3. The Clorox Company
The Clorox Company is another big spender within Homegoods. 69% of their budget is allocated to the category.
The Clorox Company has increased investment across print and digital year-over-year. Their biggest percentage increase in advertising went to Snapchat, where their investment increased more than 1000% year-over-year.
Online Video is up 69% year-over-year, Native is up 908% and Podcast investment is up over 267% YoY.
MediaRadar predicts 8 likely RFPs and can connect you with 79 key media buyers from The Clorox Company and their agencies.
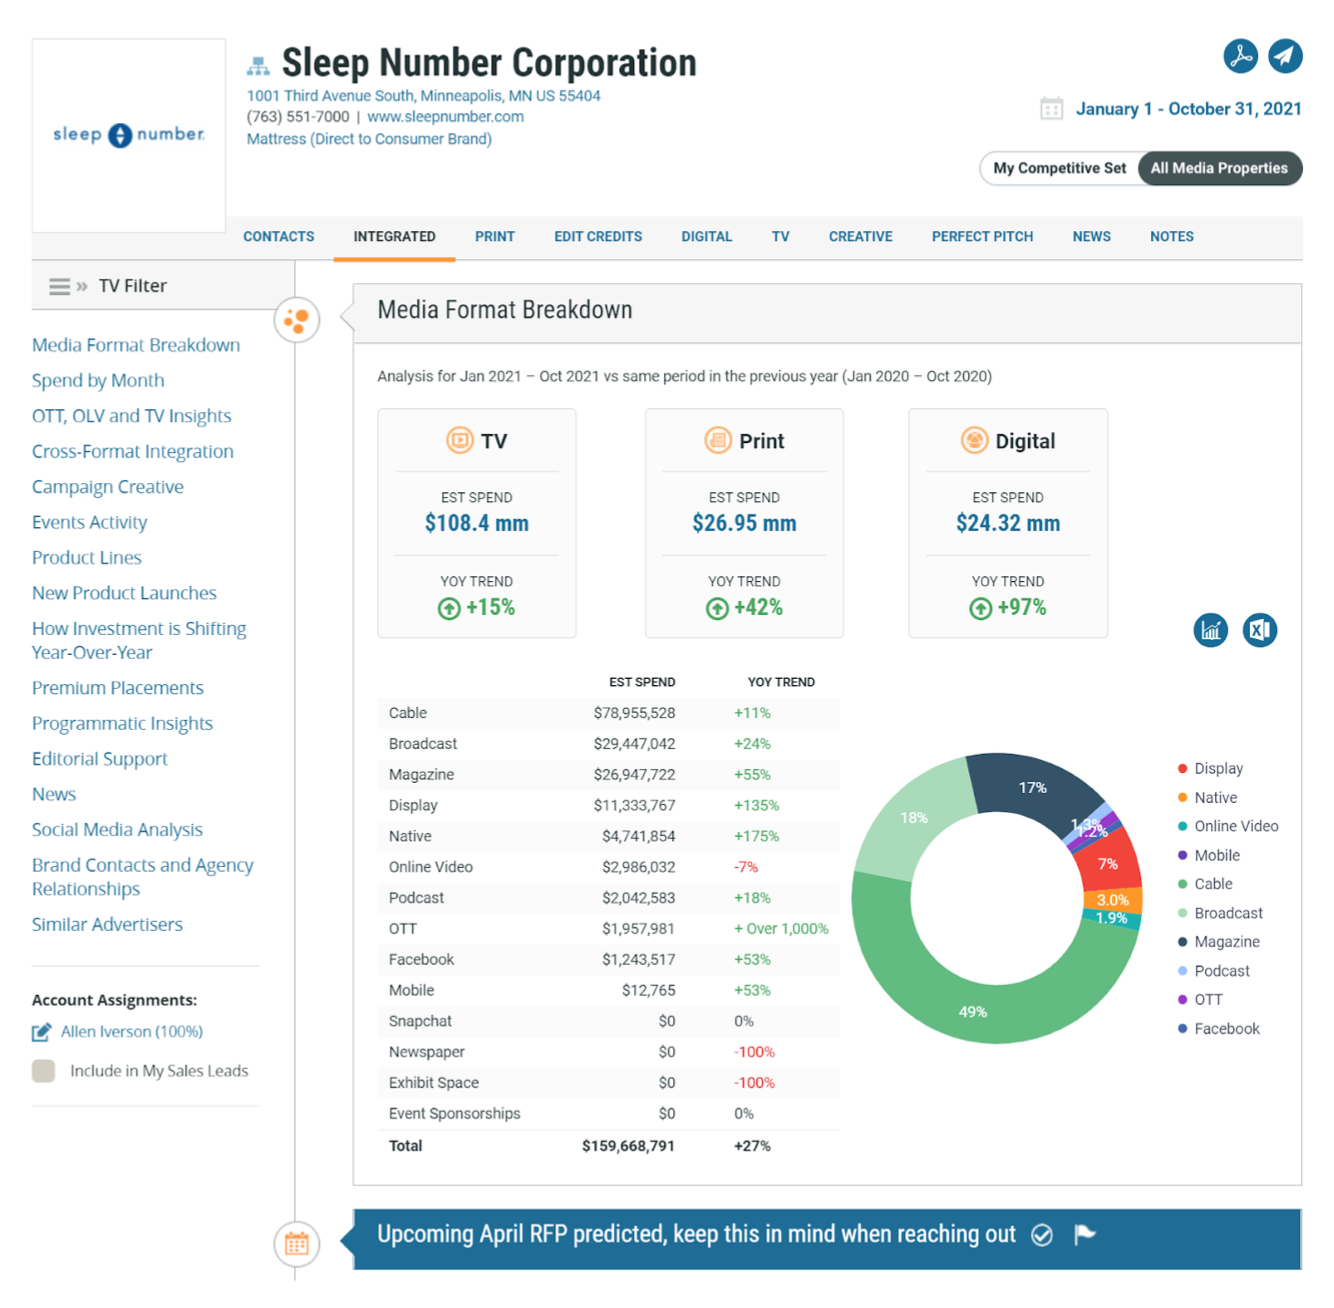
4. The Sleep Number Corporation
The Sleep Number Corporation is a heavy investor in this category. They’re spending 84% of their ad budget in the category. TV, print and digital are all up this year.
They’re spending is up 15% in TV, 42% in print and digital is up 97%.
Nearly half of their spending is invested in cable.
Below you will see a detailed breakdown of The Sleep Number Corporation’s ad spend so far. MediaRadar predicts 1 likely RFP and can connect you with 15 key media buyers from The Sleep Number Corporation and their agencies.
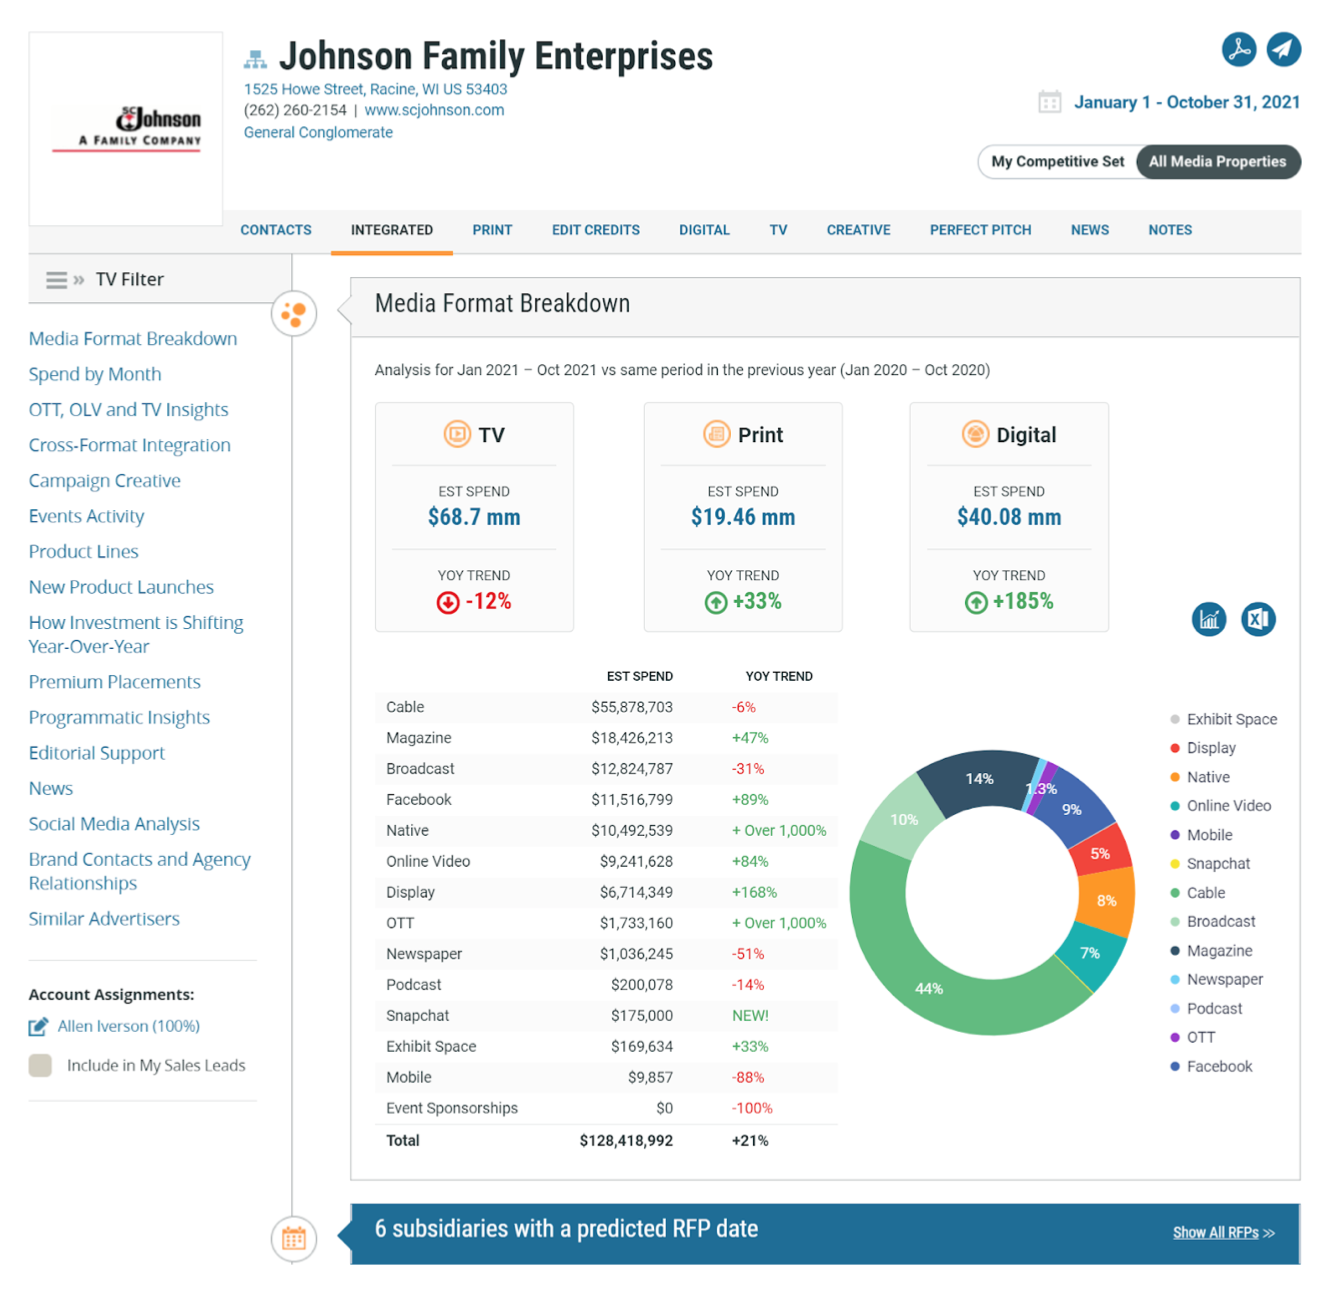
5. Johnson Family Enterprises
Eight-five percent of Johnson Family Enterprises’ spend is focused on this category.
They spend heavily in Digital, Print & TV advertising. Digital is up 185%. Print is also up 33%, while TV is down 12% year-over-year. Both Native and OTT spending is up over 1000% percent. Notably, they’re new spenders in Snapchat with an approx $175 thousand investment.
Overall, their advertising investment is up 21% YoY.
Below you will see a detailed breakdown of their ad spend so far. MediaRadar predicts 6 likely RFPs and can connect you with 30 key media buyers from Johnson Family Enterprises and their agencies.
To learn more about the data behind this article and what MediaRadar has to offer, visit https://mediaradar.com/.


Sign up to receive our stories in your inbox.
Data is changing the speed of business. Investors, Corporations, and Governments are buying new, differentiated data to gain visibility make better decisions. Don't fall behind. Let us help.


Sign up to receive our stories in your inbox.
Data is changing the speed of business. Investors, Corporations, and Governments are buying new, differentiated data to gain visibility make better decisions. Don't fall behind. Let us help.