
Our latest white paper dives into the coffee space, which has been flourishing over the past six months despite the successive COVID waves and even as the wider dining category continues to struggle. We dove into the location analytics data to find out – Who is driving the growth? What brands are the main beneficiaries of this foot traffic increase? Are there any regional differences? And what business opportunities does foot traffic data uncover?
Coffee Space Asserts Its Independence
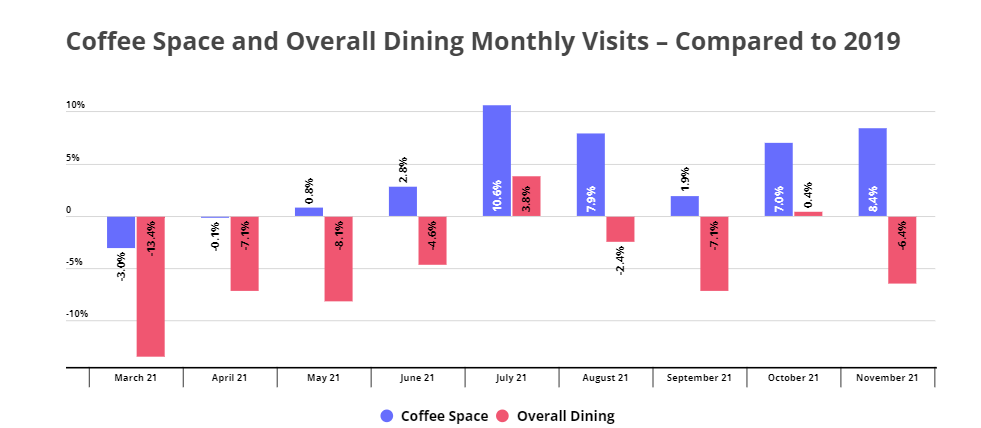
Leading coffee brands have proven to be extremely resilient to the pandemic-induced dining downturn. Foot traffic data for the coffee space shows that visits returned to pre-COVID levels already in April 2021, and have consistently outpaced 2019 numbers since May 2021. More recently, the coffee space witnessed Yo2Y growth of 8.4% and 7.5% in November and December, respectively, while overall dining experienced a decline in visits of 6.4% and 1.8% in comparison to 2019 – showing that the demand for coffee stands apart from the wider demand for dining.
And this foot traffic performance is all the more impressive given the massive disruptions to work and school that continue to persist: Despite the dramatic shifts in daily schedules and work environment, coffee visits have not only recovered – they’ve skyrocketed. This reveals that the demand for coffee can remain robust in the face of widespread disruptions to routines.
Room at the Top For Multiple National Players
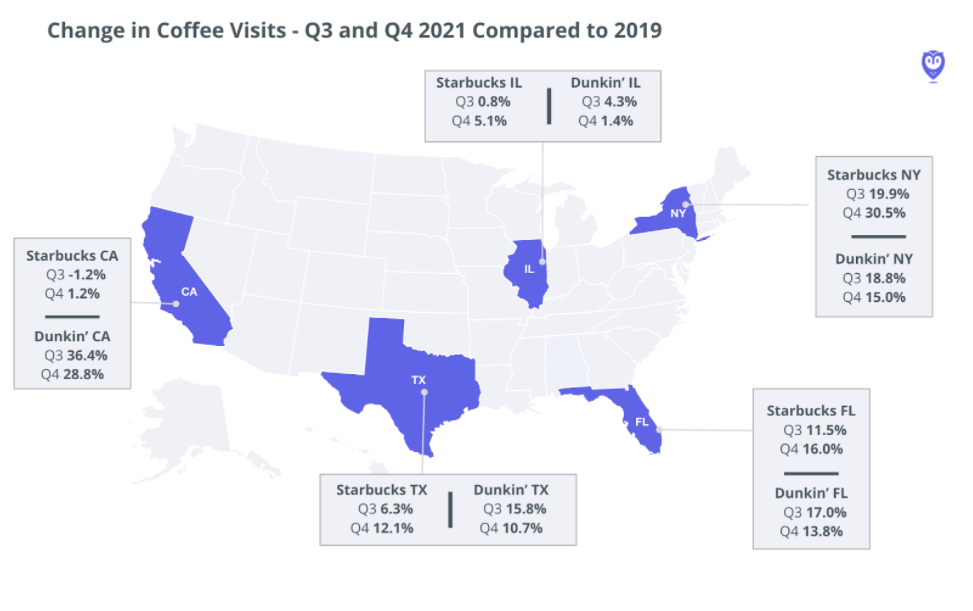
Although nearly every state experienced a Yo2Y increase in Q3 and Q4 coffee visits, zooming into the foot traffic data on a regional level reveals some interesting discrepancies.
Q4 2021 state-by-state visits to Starbucks, for example, shows that the brand experienced a much stronger Yo2Y growth in New York (30.5%) than it did in California (1.2%). Dunkin’, on the other hand, performed exceptionally well in California, with a 28.8% Yo2Y growth in visits in Q4. In the past, Starbucks was more popular on the West Coast, while Dunkin’ dominated the East Coast – but these numbers may indicate that the brands are increasingly encroaching on each other’s turf.
Data from Texas further illustrates how regional loyalties are becoming more dynamic. Dunkin’s Q3 Yo2Y growth in the Lone Star State outperformed Starbucks – but the situation reversed in Q4, when Starbucks’ increase in visits outpaced Dunkin’s. This increased ‘cross shopping’ within the coffee sector is especially important considering the wide array of players existing in or expanding the space.
The Rise of Dutch Bros. Coffee
Starbucks and Dunkin’ are usually the first brands that come to mind when thinking of national coffee chains. But there are several other national coffee players, and diving into the nationwide Yo2Y visit trends of these other major brands can tell us a lot about the current balance of power within this space.
The most prominent jump in Yo2Y visits belongs to Dutch Bros. Coffee. The brand’s astronomical rise can be attributed to its significant expansion both to new markets and within states where it already had a strong presence, and to its drive-thru-based business model, which was particularly well suited to the realities of life under COVID.
Starbucks and Dunkin’ still experienced significant Yo2Y visit increases in the second half of 2021 despite Dutch Bros.’ massive expansion, but foot traffic data indicates that the rise of the new-ish kid on the block has the potential to alter the balance of power between the major coffee giants.
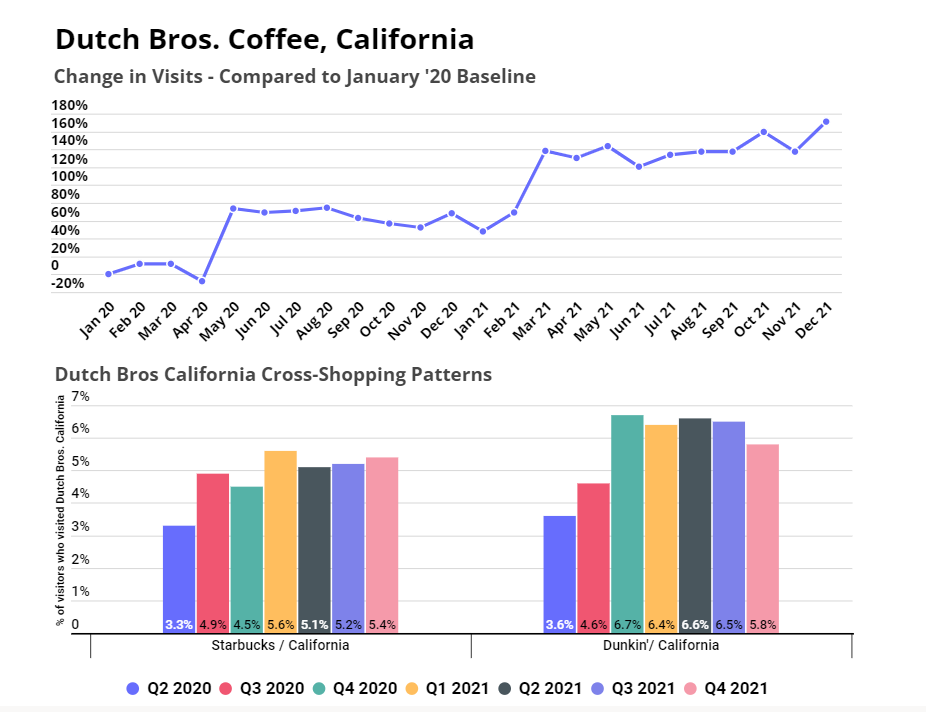
Taking California as a test case is revealing. Dutch Bros. is accelerating its expansion in the Golden State, and has seen a 170% average growth in visits between January 2020 and December 2021 – largely due to its store fleet expansion. And almost every quarter since Q2 2020, there has been an increase in the percentage of Starbucks and Dunkin’ visitors in California who also visited Dutch Bros. In Q1 2020, only 3.3% of Starbucks California visitors and only 3.6% of Dunkin’ California visitors also visited a Dutch Bros. But by Q4 2021, that percentage grew to 5.4%, and 5.8%, respectively.
To learn more about the data behind this article and what Placer has to offer, visit https://www.placer.ai/.


Sign up to receive our stories in your inbox.
Data is changing the speed of business. Investors, Corporations, and Governments are buying new, differentiated data to gain visibility make better decisions. Don't fall behind. Let us help.


Sign up to receive our stories in your inbox.
Data is changing the speed of business. Investors, Corporations, and Governments are buying new, differentiated data to gain visibility make better decisions. Don't fall behind. Let us help.