Source: https://www.placeiq.com/2022/02/sdt-traffic-patterns-indicate-consumer-enthusiasm-is-returning/
Where we sit – in New York and the San Francisco Bay Area – cases are coming down fast. Hope is on the horizon and it looks like the pattern we watched in South Africa and the UK will play out here: Omicron will spike COVID case counts like never before before leaving as fast as it arrived.
Looking at these case patterns alongside our foot traffic data, the patterns look very, very similar to the lead up to 2021’s Second Reemergence: a period of sudden foot traffic gains shared by nearly all categories. Today we’re going to walk through these echos and lay out why we think we’re going to see a pop in foot traffic and consumer enthusiasm in the coming weeks.
It’s been a long January, that’s for sure. But we’re very optimistic for March.
The Coming Post-Case-Curve Pop
One of the most interesting (and optimistic!) trends last year was the massive foot traffic boost following the decline of the Winter case curve.
We dubbed this our “Second Reemergence,” which significantly undersold the drama of the spike: “Around February 20th, it appears someone fired a starter pistol loud enough for most of the US to hear it. Overall device activity shot up so quickly we felt pretty confident the signal was an error.” After much investigation – into our own data and corroborating third party sources – we assured ourselves of the surge’s veracity. It wasn’t a mirage, foot traffic was shattering trends.
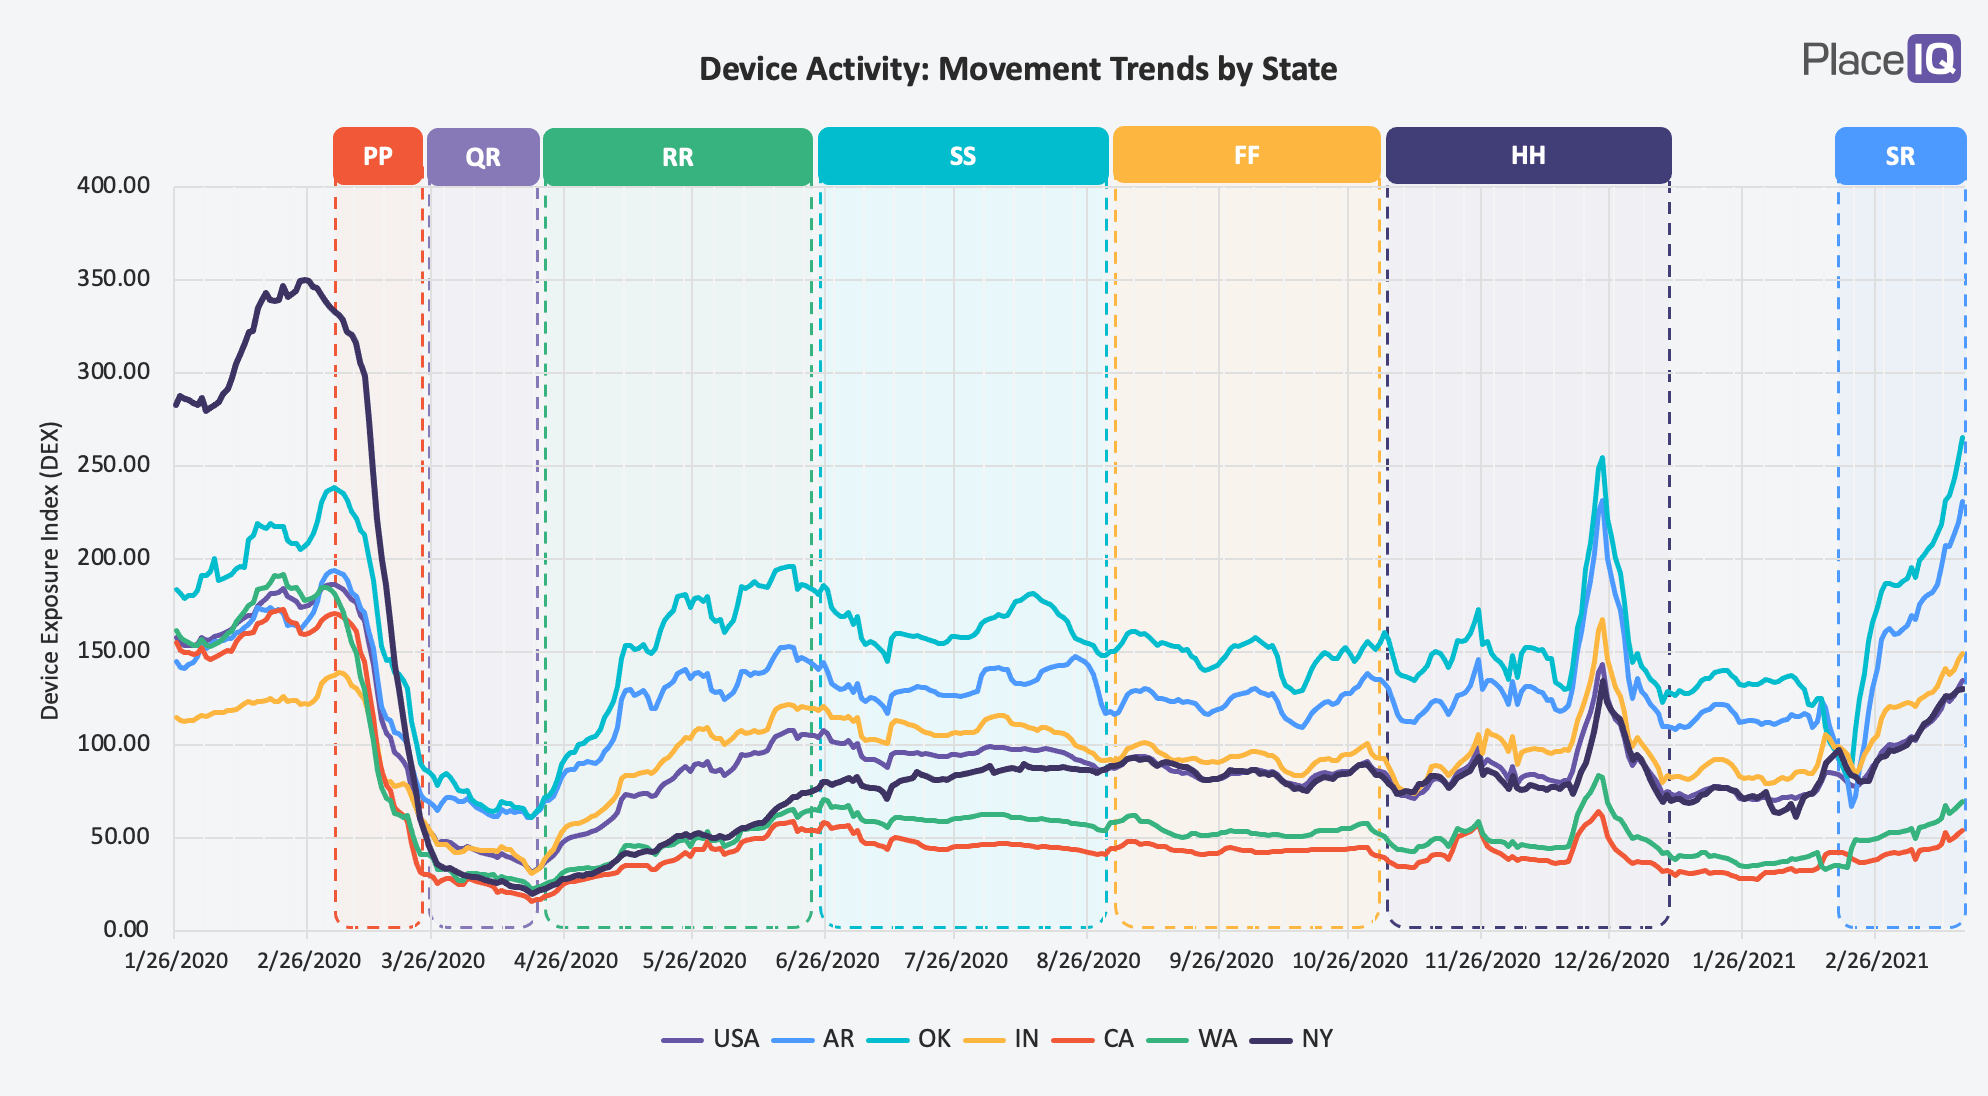
Check out the bump in the “SR” (“Second Reemergence”) phase on the far right. Nearly every category we tracked gained 20-30% almost overnight.
At the time, clients and partners asked us if this jump was due to the vaccines. Were people getting their shots and snapping back to normal life on a dime? At the time, we couldn’t say for sure, but as the story played out we could say: this bump was chiefly driven by case count declines, not vaccines. By the beginning of March 2021, vaccines were mostly only available to those 65 and older and not even 10% of the nation’s adults were inoculated. However, case counts bottomed out almost precisely when traffic spiked:
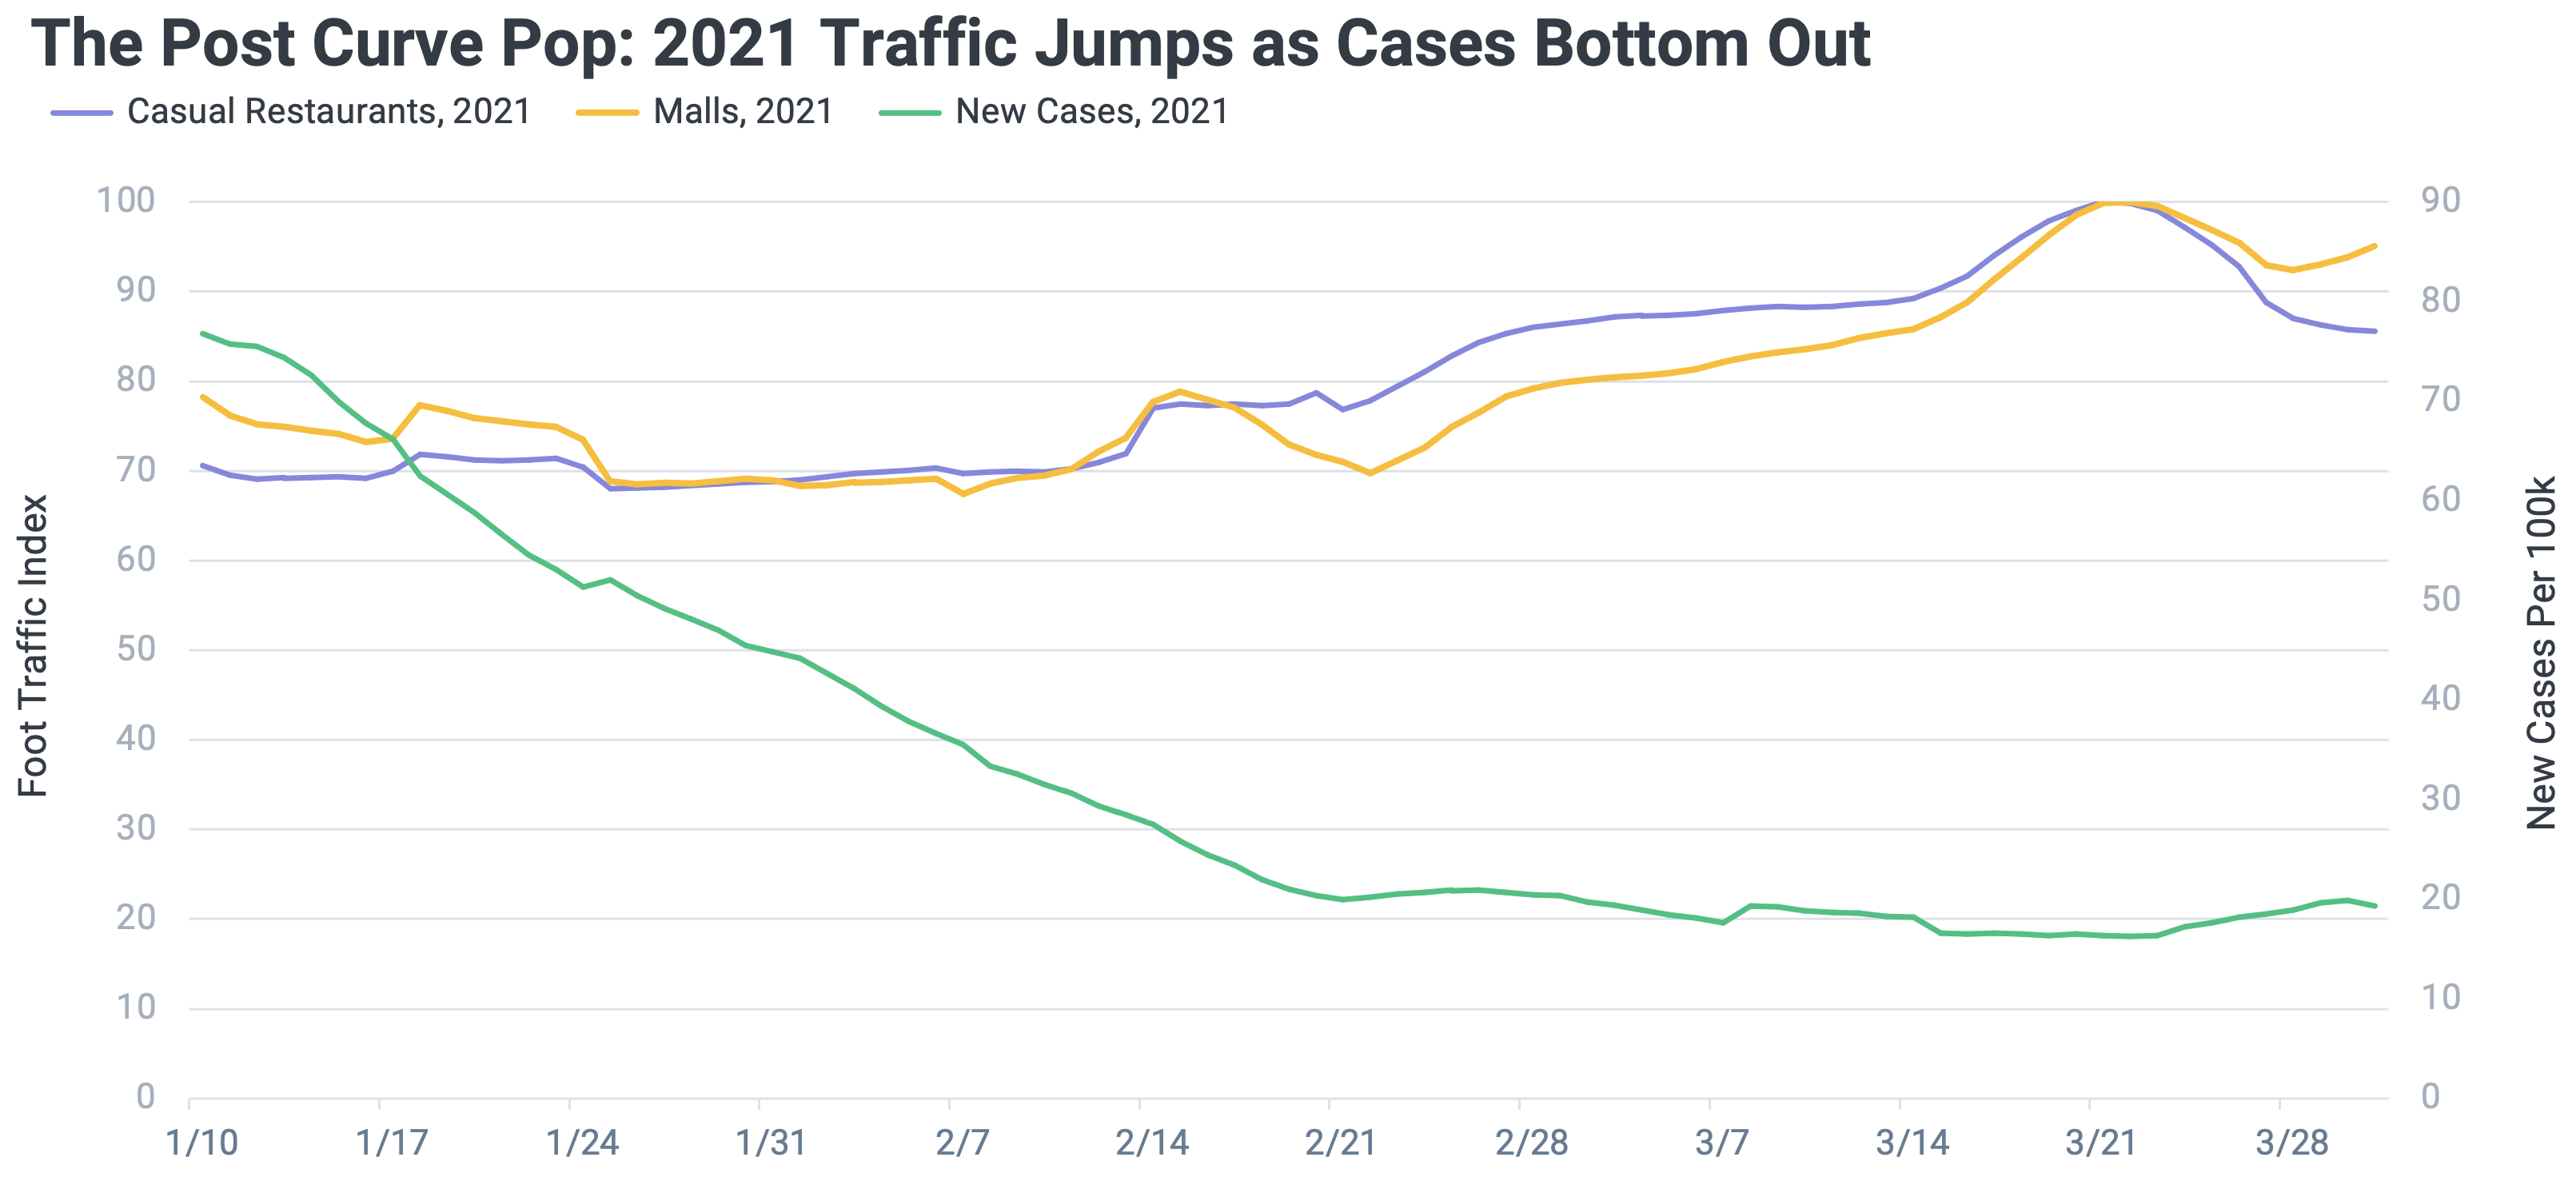
[Chart Details: Here we’re using two Y-axes. The left-hand axis is a foot traffic index relative to this time period in 2021, with 100 being max traffic in this duration. This allows us to easily compare the lines here, casual restaurants (purple) and shopping malls (yellow). We’re limiting this view to just these two categories for legibility, and because they’re often the most reactive to changes in traffic. The right-hand axis is new COVID cases in the US, per 100,000 people. All three lines are 7-day moving averages.]
As you can see, cases are declining as we come into the new year, bottoming out around February 20th. Almost precisely when mall and restaurant traffic takes off. Traffic was also up across the board, from big box stores to bars. (Though offices and other institutional venues were slower to react).
We’re recapping all of this because it sure looks like we’re set up for another foot traffic pop in the coming weeks. Take a look:
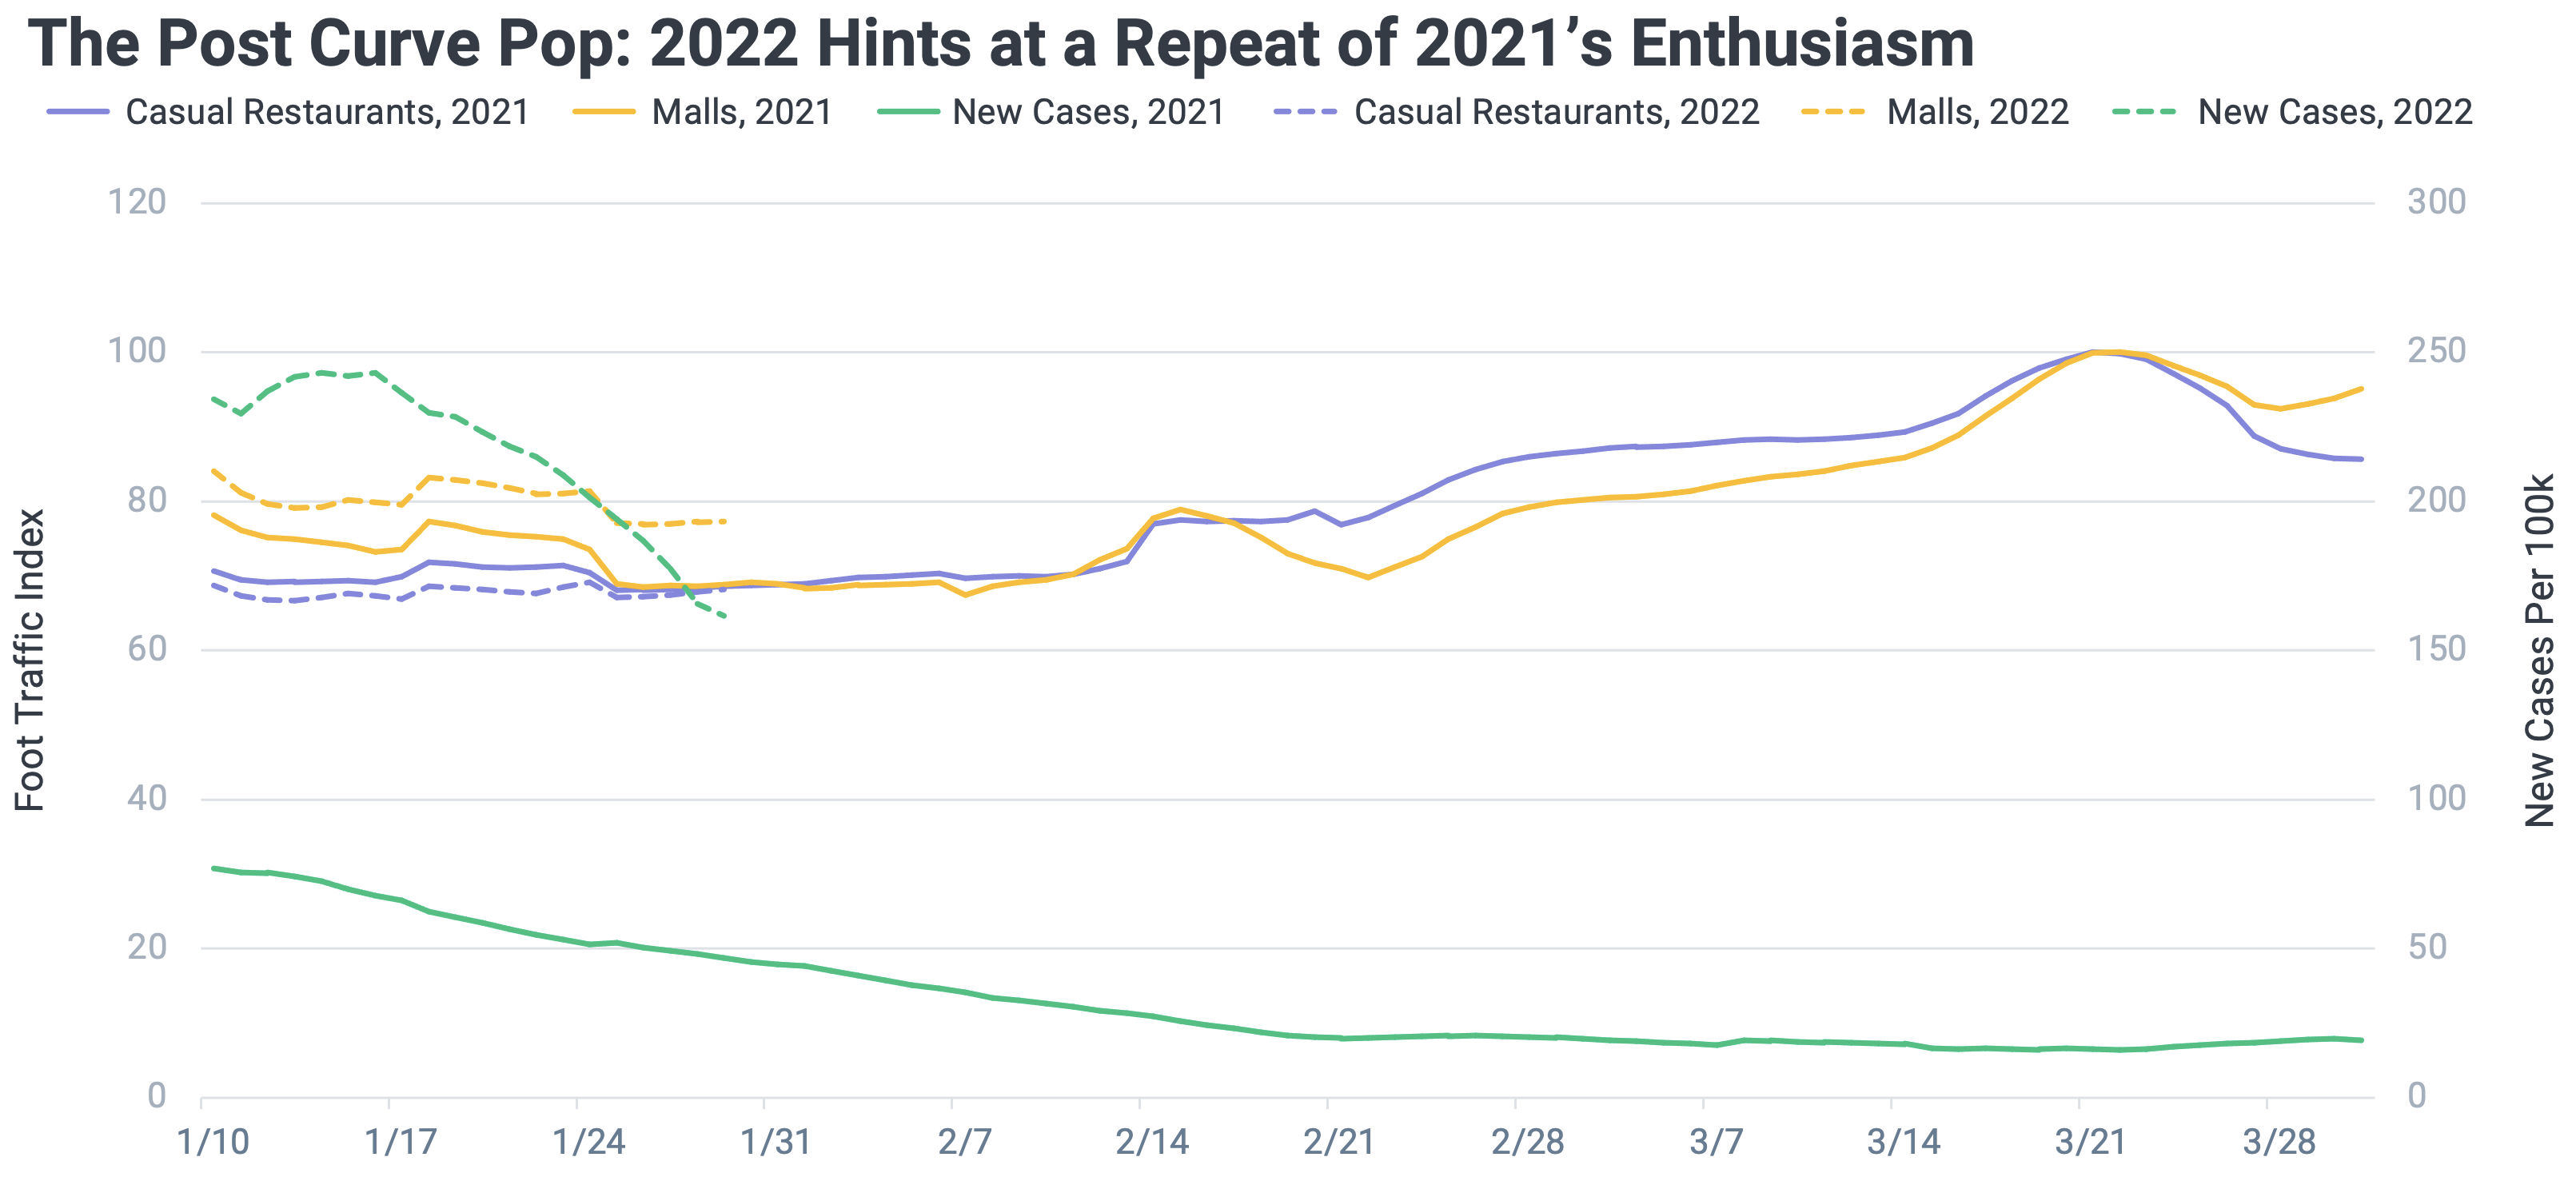
The dashed lines are the same figures, just a year later. (And we’ve shifted the dates a bit to line up the weekdays).
There’s a few differences here, chiefly the dramatically higher Omicron case count. Coming into the new year the US saw over 3x as many cases as the last. However, our case decline is moving much faster than last year’s drop. Malls and restaurants, on the other hand, are matching their previous year’s pattern almost exactly, albeit with malls at a slightly higher baseline due to a better holiday season for specialty retail than 2021.
We can’t be certain, but I would be readying my business for a pop in post-curve traffic by late February or early March.
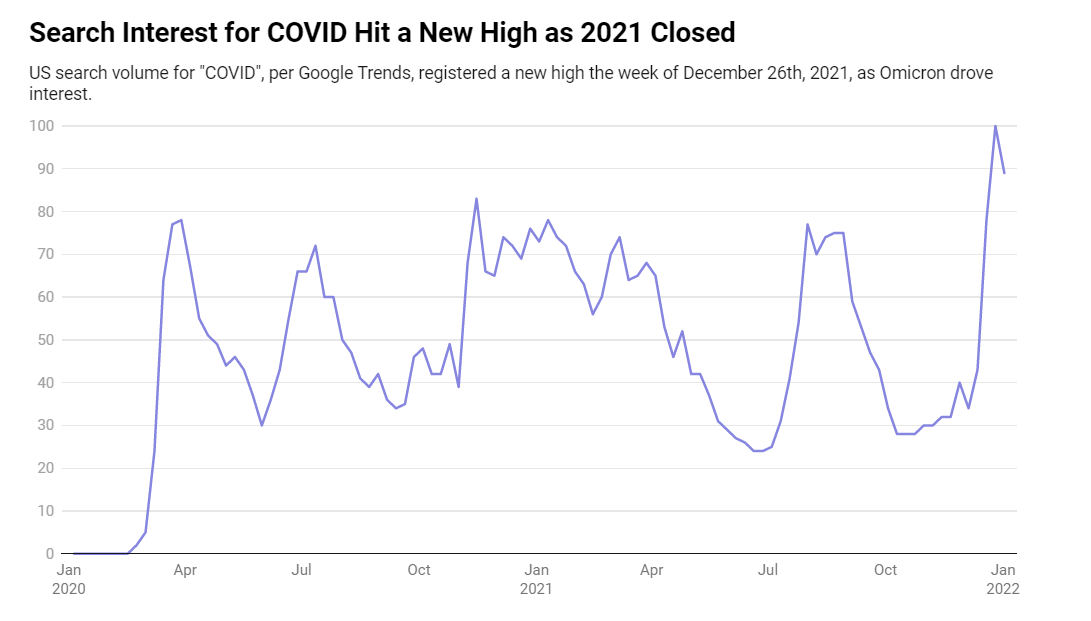
Coming into the 2021 holidays, we were filled with COVID fatigue. Omicrom snapped us back to attention. In fact, Google searches for “COVID” actually peaked the last week of 2021, even surpassing their initial spike in March of 2020:
And unlike the last 18 months, this attention and apprehension was shared across the nation. Every region reacted and pulled back:
Traffic to Casual Dining Cratered Just Before Christmas
Without exception, foot traffic to casual dining fell in every state. Here we’re comparing each state’s traffic to their respective Summer average volume (average daily traffic in June through September) and can see it all falling on cue, settling down from the Summer benchmark by at least 20%.****
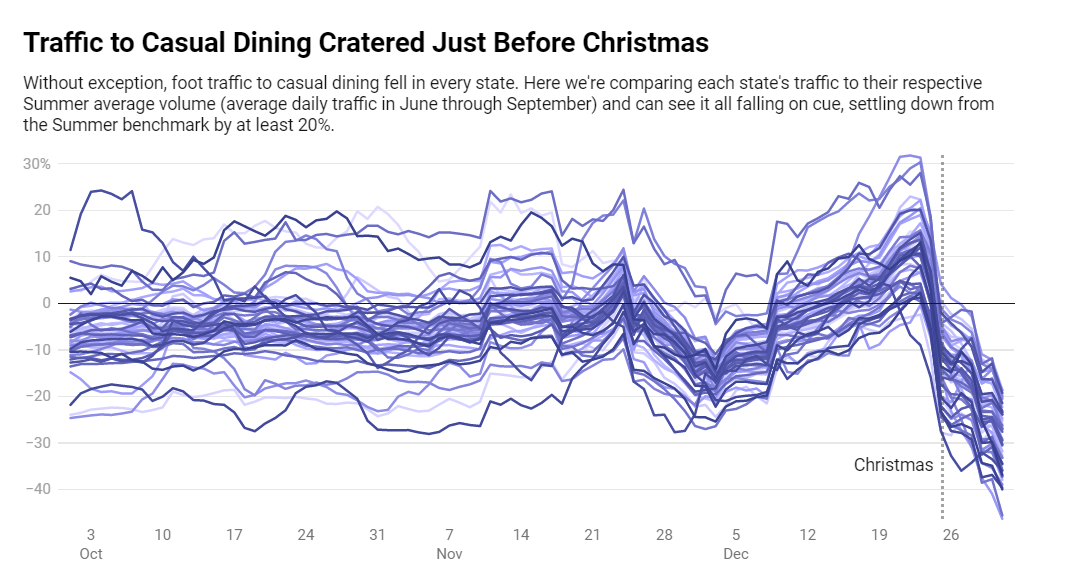
Every line in the chart above is casual restaurant traffic in a different US state. Their range of response was wide throughout most of Q4, but snapped together and pulled back just ahead of Christmas as we watched ominous case counts in South Africa and the UK.
But now, cases are rapidly declining. We don’t know what the medium term future holds, but in the short term we’re looking at a uniformly tired population who is likely ready to bolt out the door once the all clear is sounded for this wave. Just like last year.
To learn more about the data behind this article and what PlaceIQ has to offer, visit https://www.placeiq.com/.


Sign up to receive our stories in your inbox.
Data is changing the speed of business. Investors, Corporations, and Governments are buying new, differentiated data to gain visibility make better decisions. Don't fall behind. Let us help.


Sign up to receive our stories in your inbox.
Data is changing the speed of business. Investors, Corporations, and Governments are buying new, differentiated data to gain visibility make better decisions. Don't fall behind. Let us help.