Over the last few months, rising inflation, soaring fuel prices, and additional rollbacks to COVID-19 restrictions (even as new waves of cases come in) have dramatically shifted consumer spending. In today’s Insight Flash, we look at how share of wallet across income groups has changed in the last few months.
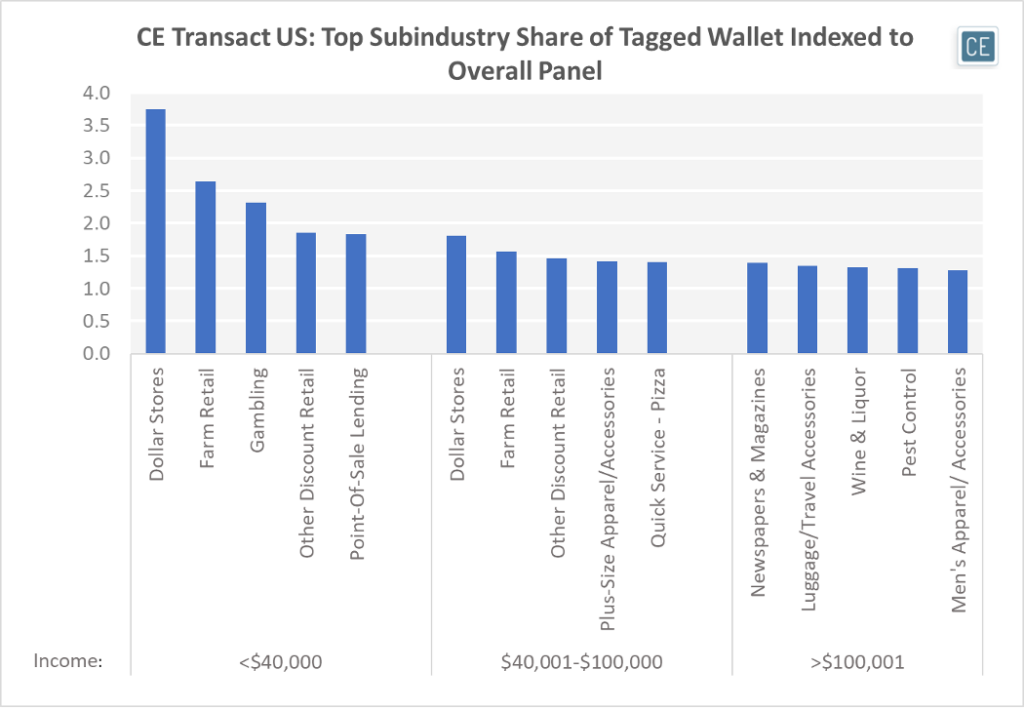
Over the last four weeks, the highest share of wallet skew has been among low income shoppers (those making less than $40,000 per year). This group has spent 3.8 times as large a percentage of their wallet on Dollar Stores as our panel average. They have also spent 2.6 times as large a percentage on Farm Retail. Those making $40,000 – $100,000 per year overindexed to those industries as well, but spending 1.8 times and 1.6 times the percentage of their wallet. However, this group did not overindex as much on Gambling, where the lowest income cohort spent 2.3 times as large a percentage of their wallet as our overall panel, or Point-Of-Sale-Lending, where this group spent 1.8 times as large a percentage. Versus other income groups, the middle income cohort was more likely to overindex spend as percent of their total purchasing on Plus-Size Apparel/Accessories and Quick Service Pizza. The highest income group, making over $100,000 per year, spent the largest share of its wallet relative to other shoppers on Newspapers and Magazines, Luggage/Travel Accessories, and Wine and Liquor.
Top Indexed Share of Wallet
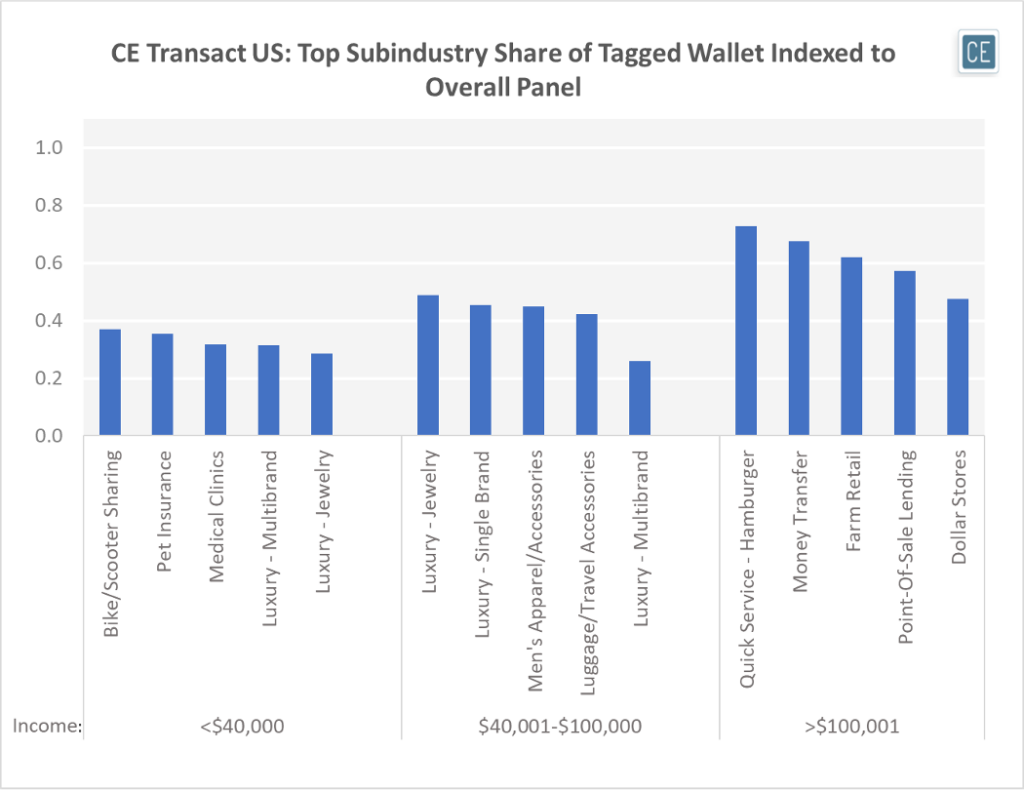
Looking at where each income group underindexes in spend as a share of their total wallet, it is unsurprising that low and middle income shoppers spend a disproportionately low share of their income on luxury products. Besides that, the lowest income group spends the lowest relative share of their wallet on medical services such as clinics for themselves and insurance for their pets. They are also much less likely to participate in bike and scooter sharing programs. The middle income group spends relatively least on Men’s Apparel/Accessories and well as Luggage/Travel Accessories. The highest income group spends the relatively lowest percentage of their wallet on Dollar Stores, Point-of-Sale-Lending, Farm Retail, Money Transfer, and Quick Service Hamburgers.
Bottom Indexed Share of Wallet
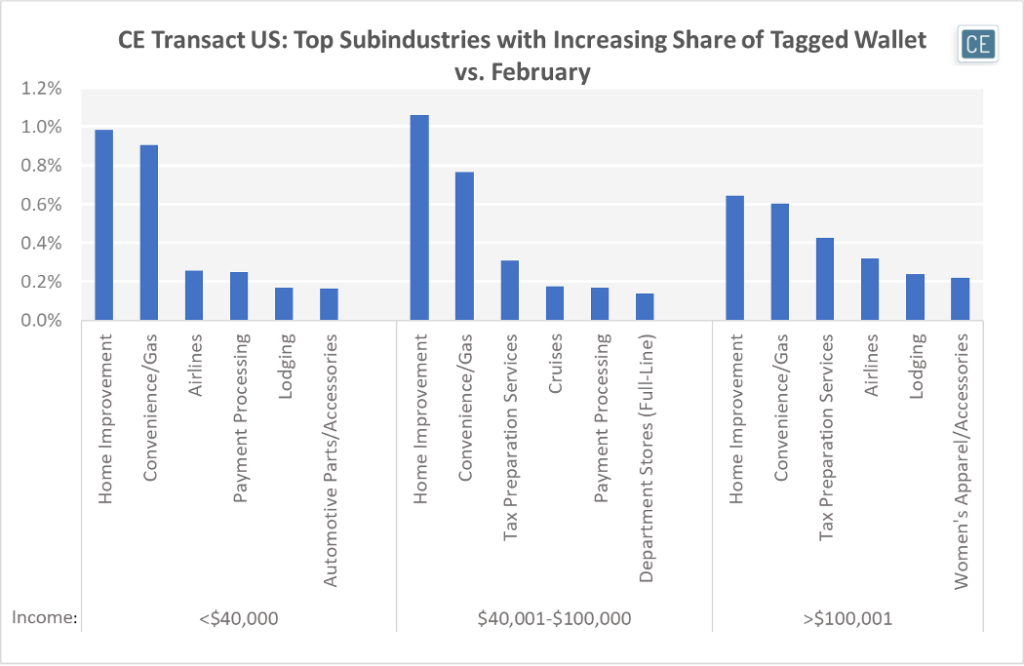
Since February, the largest increases in share of wallet have been mostly consistent across income groups. Seasonal increases in Home Improvement spend have increased the most as a percentage of middle income shoppers’ total wallet. Increases in fuel prices have affected low income shoppers the most with the highest increase in Convenience/Gas share of wallet. Seasonal spend on travel has shifted differently for each income group, with the middle income group spending a larger share of relative spend on Cruises while the other two groups spent a larger relative share on Airlines and Lodging. The middle and high income groups spent a larger share of income on tax prep, a service the lower income group may not use as much or might be more likely to spend on earlier in the tax season to get a quicker refund. Beyond these, it is interesting to see that the biggest increase in spend for low income share of wallet is Automotive Parts/Accessories versus Full-Line Department Stores for middle income shoppers and Women’s Apparel/Accessories for the highest income group.
Changes in Wallet Share Since February
To learn more about the data behind this article and what Consumer Edge Research has to offer, visit www.consumer-edge.com.


Sign up to receive our stories in your inbox.
Data is changing the speed of business. Investors, Corporations, and Governments are buying new, differentiated data to gain visibility make better decisions. Don't fall behind. Let us help.


Sign up to receive our stories in your inbox.
Data is changing the speed of business. Investors, Corporations, and Governments are buying new, differentiated data to gain visibility make better decisions. Don't fall behind. Let us help.