
Beauty products are often seen as an “affordable luxury,” and shoppers looking for budget-friendly splurges are increasing their offline beauty visits even as discretionary spending in other categories drops. To better understand the current beauty surge, we dove into Ulta Beauty’s year-to-date foot traffic performance to see how the wider economic situation is boosting this already strong retailer.
Ulta Building on Last Year’s Strength
The “lipstick effect” (sometimes called the “lipstick index”) posits that in times of economic stress, consumers will indulge in discretionary purchases – such as lipstick – that provide an emotional uplift without breaking the bank. Recently, as shoppers tightened their budgets in the face of high inflation and cut down on dining out, mall trips, and even coffee, beauty purchases surged, with sales of premium beauty products seeing a particularly marked increase.
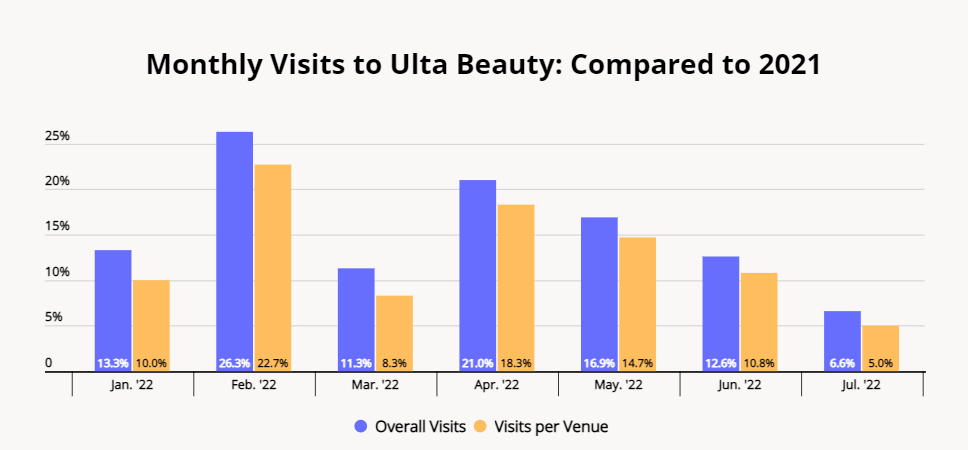
Foot traffic data reveals that Ulta Beauty – a leader in the brick-and-mortar (and online) beauty retail space – is one of the big beneficiaries of this increased beauty demand. Following an already strong 2021, foot traffic to Ulta stores further increased this year, with year-over-year (YoY) monthly visits up every month of 2022 so far on both an overall and visits-per-venue basis.
Although Ulta has invested heavily in virtual try-on technology, many beauty shoppers still prefer to visit physical stores so they can see, feel, and try on products before making a purchase. The strong YoY foot traffic trends may indicate that many of those who transitioned to online beauty shopping at the height of COVID have now made their way back to physical stores.
Ulta’s Long-Term Expansion Potential
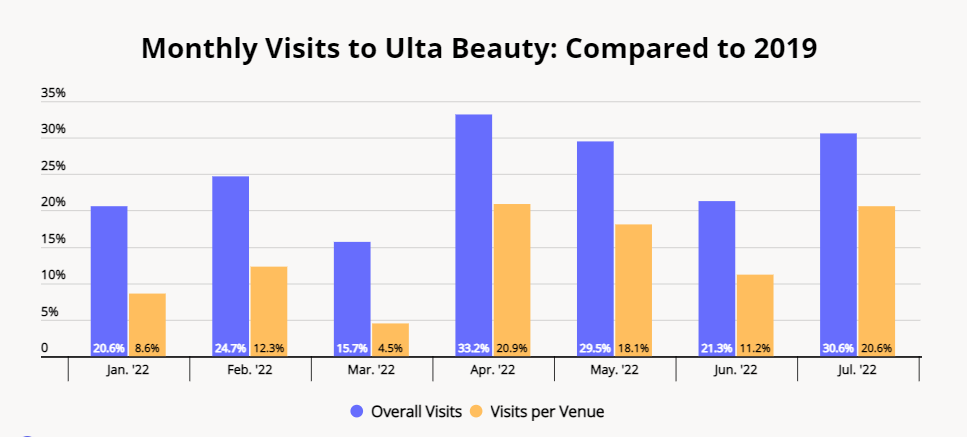
Ulta’s strength becomes even more apparent when comparing current visits to pre-pandemic levels: Year-over-three-year (Yo3Y) overall monthly foot traffic to Ulta is up by double-digits every month since the beginning of 2022.
Some of the overall increase in visits is due to Ulta’s store fleet growth over the past couple of years. But visits per venue have also grown significantly, with July 2022 Yo3Y visits up 30.6% overall and 20.6% on a visits per venue basis. This means that the chain’s expansion is meeting with an eager customer base.
According to its 2021 annual report, the company operated 1,264 stores in January 2022 (up from 1,174 in February 2020) and has the potential to grow its store fleet to 1,500-1,700 freestanding Ulta stores in the long term. The significant growth in visits per venue over the past three years seems to support the brand’s expansion plans by confirming the strong demand for physical Ulta stores.
How Has Ulta’s Offline Traffic Changed Since 2019?
Foot traffic analytics can show more than just the number of visits to each location – it can also reveal where visitors are coming from, who these visitors are, and how often they return.
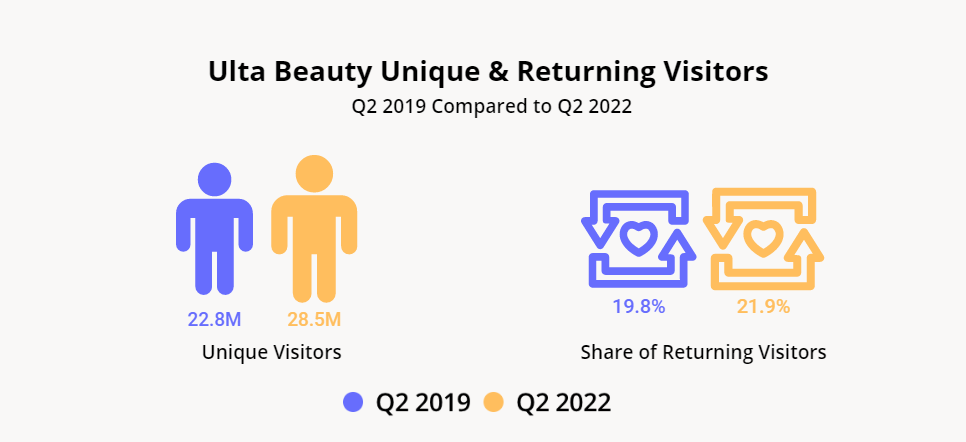
Analyzing Ulta locations in the U.S. show that both the number of unique quarterly visitors and the share of returning quarterly visitors increased between Q2 2019 and Q2 2022. This means that Ulta is maintaining – and even increasing – loyalty among its existing customers while successfully attracting new visitors. Ulta’s efforts to add new brands is likely contributing to its success in this area – as the company diversifies its inventory, it increases its potential to reach a wider variety of beauty shoppers.
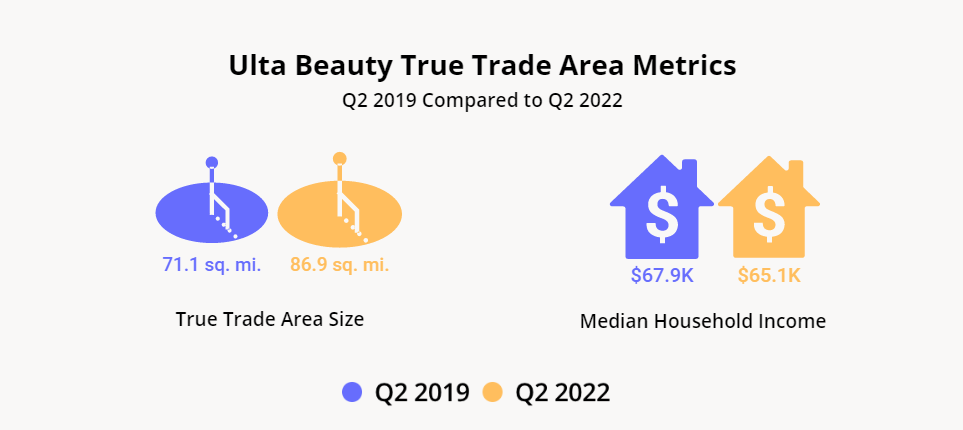
The data also shows that the average True Trade Area for the Ulta locations increased from 71.1 square miles in Q2 2019 to 86.9 square miles in Q2 2022. Consumers’ willingness to drive further to visit Ulta stores despite this year’s gas hikes is yet another testament to Ulta’s current brick and mortar strength.
Lastly, combining foot traffic data with other data sets can uncover an additional layer of insights. In Ulta’s case, incorporating data from the 2019 census into the trade area analysis shows that the median household income (HHI) in Ulta’s Q2 2019 trade area was $67,897, compared to a median HHI of $65,078 for Ulta’s Q2 2022 trade area. This means that Ulta is seeing an expansion of who their customers are when compared to Q2 2019, which may offer further support for the “lipstick effect”. Middle– and lower-income consumers are likely feeling a greater inflationary pinch, which may be leading them to avoid larger purchases – and visit the beauty retailer for smaller, budget-friendly thrills.
To learn more about the data behind this article and what Placer has to offer, visit https://www.placer.ai/.


Sign up to receive our stories in your inbox.
Data is changing the speed of business. Investors, Corporations, and Governments are buying new, differentiated data to gain visibility make better decisions. Don't fall behind. Let us help.


Sign up to receive our stories in your inbox.
Data is changing the speed of business. Investors, Corporations, and Governments are buying new, differentiated data to gain visibility make better decisions. Don't fall behind. Let us help.