The Placer.ai Nationwide Office Building Index: The office building index analyzes foot traffic data from more than 700 office buildings across the country. It only includes commercial office buildings and commercial office buildings on the first floor (like an office building that might include a national coffee chain on the ground floor). It does NOT include mixed-use buildings that are both residential and commercial.
We’ve covered the office recovery extensively over the past year. With the recovery entering a more stable phase, we examined office foot traffic trends and looked at how the prevalence of different kinds of employers in each city is impacting the local workplace recoveries.
Changes in Office Spaces
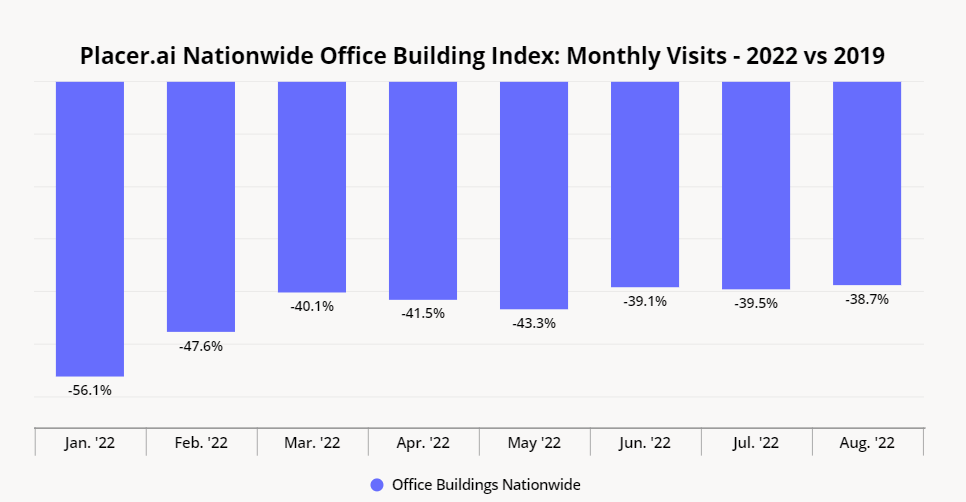
The pandemic seems to have permanently changed office norms, and most businesses have accepted that hybrid work is here to stay. But while foot traffic has yet to return to pre-pandemic levels, offices nationwide are seeing a slow but steady visits recovery. January saw the biggest decrease in foot traffic, with 56.1% fewer visitors year-over-three-year (Yo3Y). Since then, the visit gaps have been narrowing, culminating in August’s 38.7% Yo3Y visit gap – the smallest seen all year – suggesting that while things may be progressing slowly, the office recovery is happening. Still, it seems that most workers will not return to the pre-pandemic norm, five-day work week from the office, any time soon.
These sustained changes are leading some companies to rethink their offices entirely. Some businesses are embracing the coworking concept – Lyft, after announcing a fully hybrid work model in March, decided to sublet around 50% of its four office buildings (located in New York, San Francisco, Nashville, and Seattle) to other businesses. And pension fund investors have chosen to cut back their investments in office buildings, seeing them as a riskier bet.

Year-over-Year Recovery Ticks Up
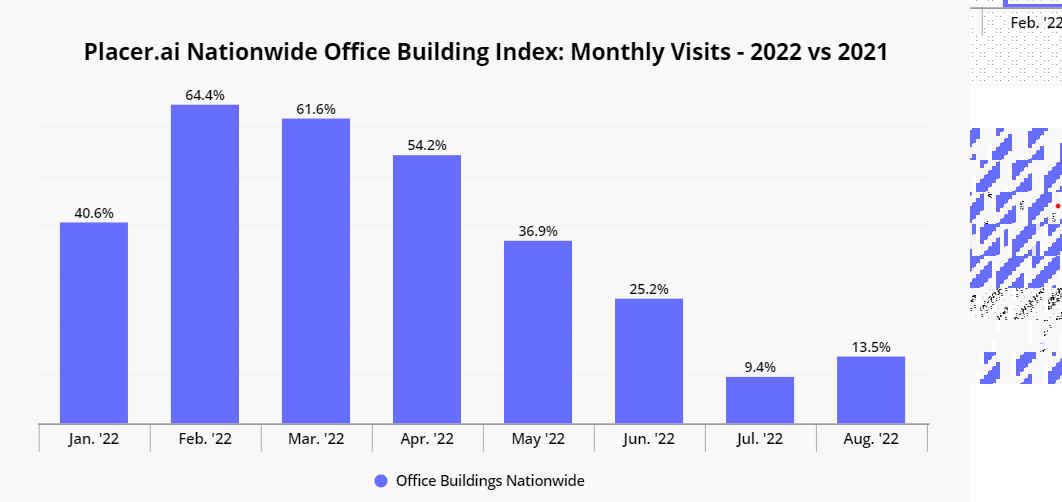
Year-over-year (YoY) trends, meanwhile, show more variance. Fully remote work was still commonplace during the height of the pandemic in early 2021, so the beginning of 2022 saw YoY foot traffic elevated significantly. But with vaccines becoming widely available in April 2021, workers began returning to their offices – so the comparisons to months when the workplace recovery was already underway led to narrowing visit gaps from May 2022 onward.
May and June 2022 saw office visits increase 36.9% and 25.2% YoY, and though July’s numbers pulled downward to 9.4% YoY growth, YoY foot traffic increased again in August, with 13.5% more visits than the previous year. The quick correction of a mild downward swing combined with the consistently positive visit growth is a promising sign for office buildings and indicates that the recovery is still ongoing.

Minimal Month-over-Month Drops in August
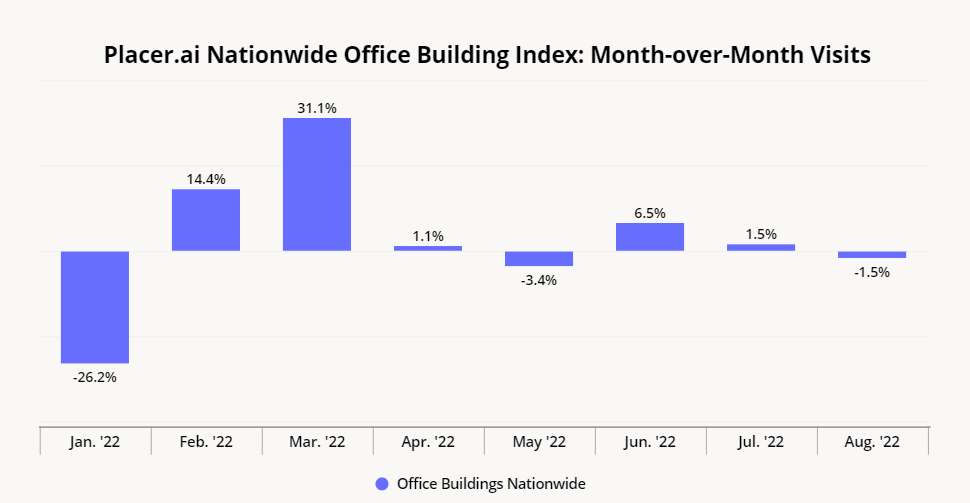
After an Omicron-induced drop in month-over-month (MoM) office visits in January, February and March saw significant MoM growth. April and May saw MoM visits trend slightly down, as rising gas prices incentivized workers to stay home, but picked up again in June and July. And despite August being one of the most popular months for vacation, the month saw only a minor downturn of 1.5% fewer office visitors than July – another positive sign for the ongoing workplace recovery.

Differing Recoveries by Region
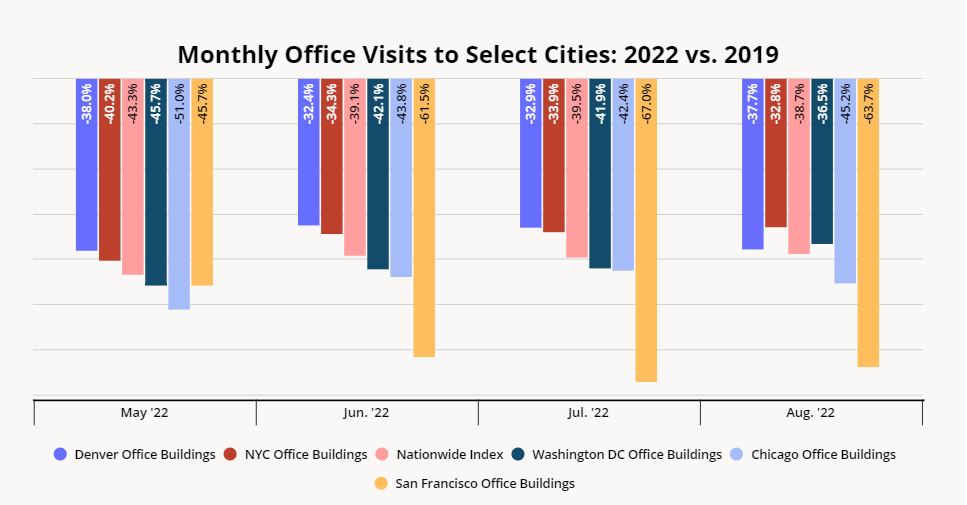
Digging into individual city data shows that some are exceeding the nationwide average, with foot traffic to offices in New York City, Denver, and Washington, D.C. tracking with, or exceeding the nationwide average since January 2022.
The regional variance in office foot traffic recovery may be attributed to the dominant sector in a given geographical area. New York City is home to many finance and healthcare institutions, which have been less open to work-from-home or hybrid work, and that may be leading to higher than average Yo3Y office visits. In Washington, D.C., where Yo3Y office visits exceeded the nationwide average in August 2022 for the first time all year, the return of federal workers may be driving nearby law firms and other businesses that work closely with government officials to bring their employees back as well.
Meanwhile, the tech industry, which has a large presence in San Francisco, is more amenable to remote work, with a recent survey suggesting that 85% of tech workers are either working fully remotely or in a hybrid model. This may explain San Francisco’s lagging office recovery – in August, the city saw 63.7% fewer office visits Yo3Y.
Migration trends can also impact the return to office in a given locale. Denver, which saw a significant uptick in the number of people moving in over the past few years, also saw a strong office return. July and August 2022 saw 32.9% and 37.7% fewer visits to Denver offices, tracking or exceeding the national average of 39.5% and 38.7%, respectively. And Chicago, where Yo3Y visits are slightly trailing nationwide visit averages, saw the population of its CBSA drop 1.9% between July 2019 and July 2022 according to Placer.ai migration data.

Settling Into the New Normal
As foot traffic continues its steady upward trajectory, many companies are planning on reducing the amount of office space they hold and finding creative tenants for their offices.
To learn more about the data behind this article and what Placer has to offer, visit https://www.placer.ai/.


Sign up to receive our stories in your inbox.
Data is changing the speed of business. Investors, Corporations, and Governments are buying new, differentiated data to gain visibility make better decisions. Don't fall behind. Let us help.


Sign up to receive our stories in your inbox.
Data is changing the speed of business. Investors, Corporations, and Governments are buying new, differentiated data to gain visibility make better decisions. Don't fall behind. Let us help.


