About the Office Building Indexes:
These indexes analyze foot traffic data from more than 700 office buildings (53 in San Francisco, 70 in Manhattan, 50 in Dallas, 50 in Denver, 50 in Boston, 50 in Los Angeles, 50 in Atlanta, 51 in Houston and 61 in Chicago). They only include commercial office buildings and commercial office buildings on the first floor (like an office building that might include a national coffee chain on the ground floor). They do NOT include mixed-use buildings that are both residential and commercial.
Placer.ai uses anonymized location information from a panel of 30 million devices and processes the data using industry-leading AI and machine learning capabilities to make estimations about overall visits to specific locations.
Diving into the September 2022 Office Recovery
With many employers still struggling to bring workers back to the office, we took a look at September 2022 office foot traffic data to find out where the workplace recovery stands heading into Q4 2022.
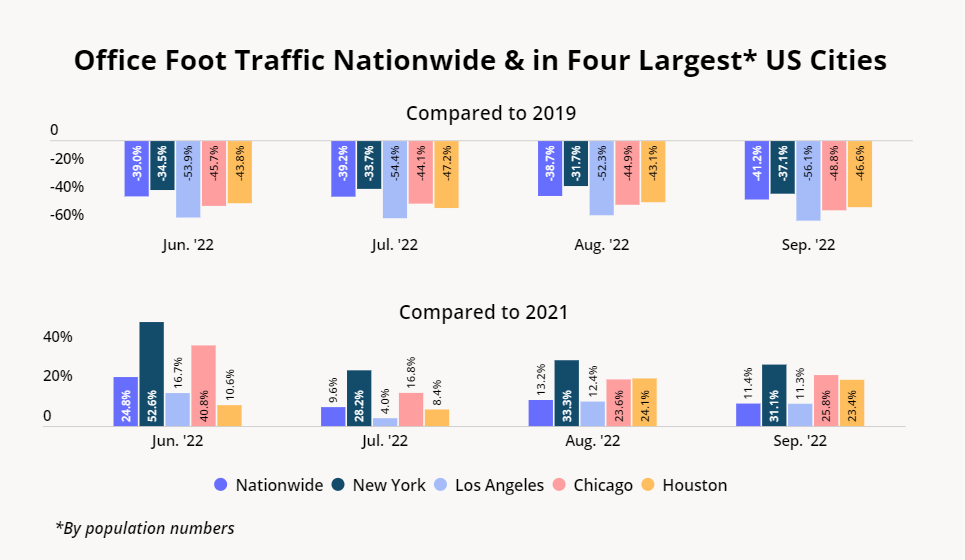
New York City Beats the Curve
Over the past couple of months, New York City office workers have consistently outpaced both the nationwide and other major cities in both year-over-three-years (Yo3Y) and year-over-year (YoY) monthly office foot traffic numbers.
The trend continued in September 2022, with New York City (Manhattan) offices seeing a visit gap of 37.1% compared to 2019, and a 31.1% YoY increase. This compared to a nationwide Yo3Y drop of 41.2% and YoY rise of 11.4% over the same period. Notably, New York City is beating the curve despite being consistently ranked as having one of the highest commute times in the nation – but the city also has a larger than usual share of workers commuting to work via transit (as opposed to driving to work). This may indicate that the fear of sitting in traffic or spending too long behind the wheel area is keeping some workers in other major cities from emulating New York’s return to office rates.
Chicago and Houston’s office recoveries are now progressing in tandem, even though Chicago’s earlier YoY office foot traffic numbers were surpassing Houston’s – perhaps due to Chicago’s stricter COVID requirements in spring and early summer 2022. Both cities are lagging slightly behind the nationwide average, with September 202 office visits in Chicago and Houston down 48.8% and 46.6% Yo3Y, respectively.
Meanwhile, Los Angeles offices have yet to pass the 50% mark, with September 2022 office visits 56.1% lower than they were in September 2019 – perhaps in part due to the pandemic “California exodus.”
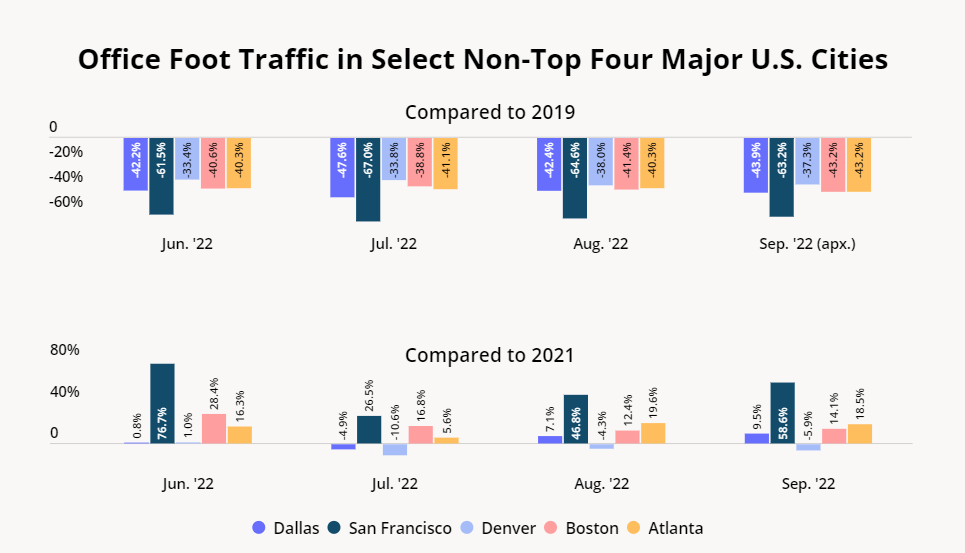
Denver, CO Leads Non-Top Four Workplace Recovery
Among the five other major cities analyzed, Denver leads the workplace recovery, with only a 37.3% Yo3Y visit gap in September 2022. At the same time, Denver’s has seen a slight decrease in YoY foot traffic over the past three months, indicating that the workplace occupancy in the city should not be expected to increase significantly any time soon.
Like with Houston and Los Angeles, Dallas (-43.4% Yo3Y) is seeing a significantly smaller office visit gap than San Francisco (-62.8% Yo3Y) – even though San Francisco is showing impressive YoY increases, which may indicate that the city’s office recovery is still in full swing. Still, the discrepancy in office recoveries between cities in Texas and California may have to do with the inbound migration to the Lone Star State from the Golden State over the past couple of years.
Meanwhile, in both Boston and Atlanta, Yo3Y visits were down 43.2% in September – slightly below the nationwide average – indicating that the office recovery is not necessarily progressing faster in smaller metros.
In most cities, it appears that the office recovery has essentially plateaued, with many employers settling on some form of hybrid work. Most cities are hovering at around a 40% visit gap, which is most companies adopting a three-day in-office schedule. But with inflation and a changing labor market beginning to impact the power dynamics between employees and their bosses, the office recovery story may still have many key chapters ahead.
To learn more about the data behind this article and what Placer has to offer, visit https://www.placer.ai/.


Sign up to receive our stories in your inbox.
Data is changing the speed of business. Investors, Corporations, and Governments are buying new, differentiated data to gain visibility make better decisions. Don't fall behind. Let us help.


Sign up to receive our stories in your inbox.
Data is changing the speed of business. Investors, Corporations, and Governments are buying new, differentiated data to gain visibility make better decisions. Don't fall behind. Let us help.