
About the Office Building Indexes:
These indexes analyze foot traffic data from more than 280 office buildings in various cities (53 in San Francisco, 70 in Manhattan, 51 in Houston, 61 in Chicago, and 50 in Miami). They only include commercial office buildings and commercial office buildings on the first floor (like an office building that might include a national coffee chain on the ground floor). They do NOT include mixed-use buildings that are both residential and commercial.
Placer.ai uses anonymized location information from a panel of 30 million devices and processes the data using industry-leading AI and machine learning capabilities to make estimations about overall visits to specific locations.
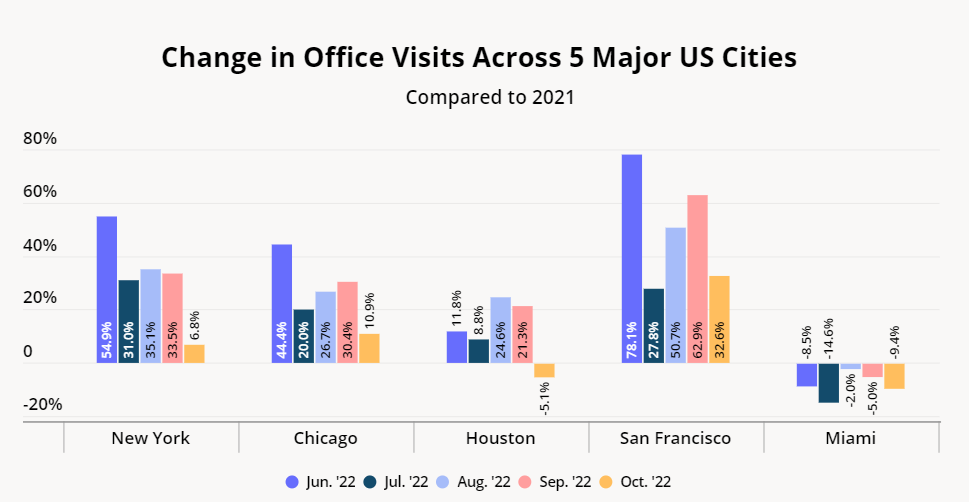
Year-over-Year Foot Traffic Growth Turns Negative in Some Cities
The office recovery has plateaued over the past couple of months as many workers settle into a hybrid working model, and the pattern largely continued in October. New York City and Chicago saw the smallest year-over-year (YoY) increase in monthly office visits since the start of the workplace recovery in April 2021, with October visits up by only 6.8% and 10.9%, respectively. In Houston and Miami, where the office recovery started earlier and picked up steam faster than in the rest of the country, visits were actually slightly lower this October when compared to last year – a clear sign that the return to office rates are leveling off in some regions – at least temporarily.
San Francisco, on the other hand, has had one of the slowest workplace recoveries – and the city also saw the largest YoY increase in office visits out of all five cities analyzed, with October 2022 visits up 32.6% YoY. So although the workplace recovery has slowed down – or even stalled – in some areas, other cities are still seeing a slow and steady office return.
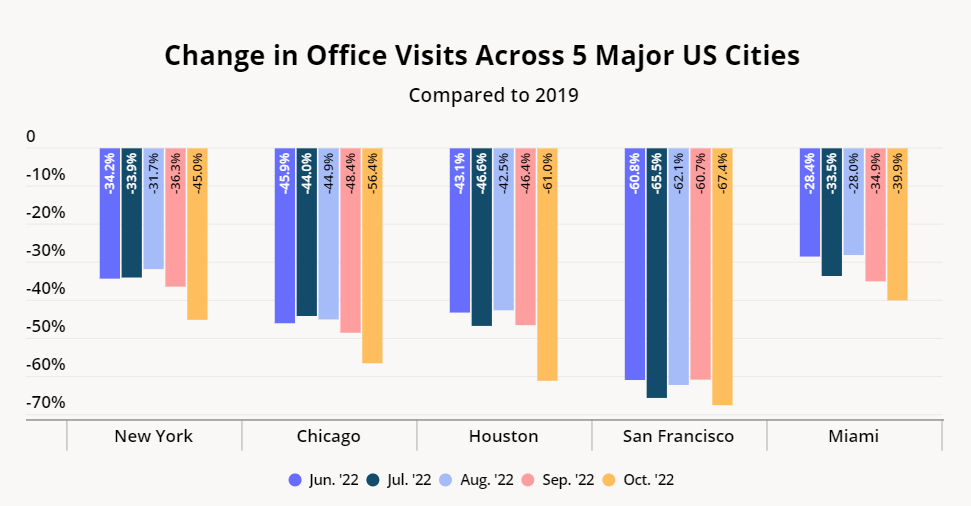
Year-over-Three-Year Visit Gaps Grow
Year-over-three-year (Yo3Y) office visits also showed significant regional variance, although some common patterns have emerged. All five cities analyzed saw their Yo3Y visit gaps grow in October, with office visits in New York, Chicago, Houston, San Francisco, and Miami down 45.0%, 56.4%, 61.0%, 67.4%, and 39.9%, respectively, when compared to October 2019.
But while visit gaps increased across the board, it’s critical to remember that these numbers represent Yo3Y visits, and not visitors – so the October declines could be due to people working from the office fewer days a week, rather than to a drop in the total number of office visitors. October brought the first real cold spells to much of the country, so some workers may have worked from home an extra couple of days as they adjusted to the change in seasons – which in turn may have brought Yo3Y visit numbers down.
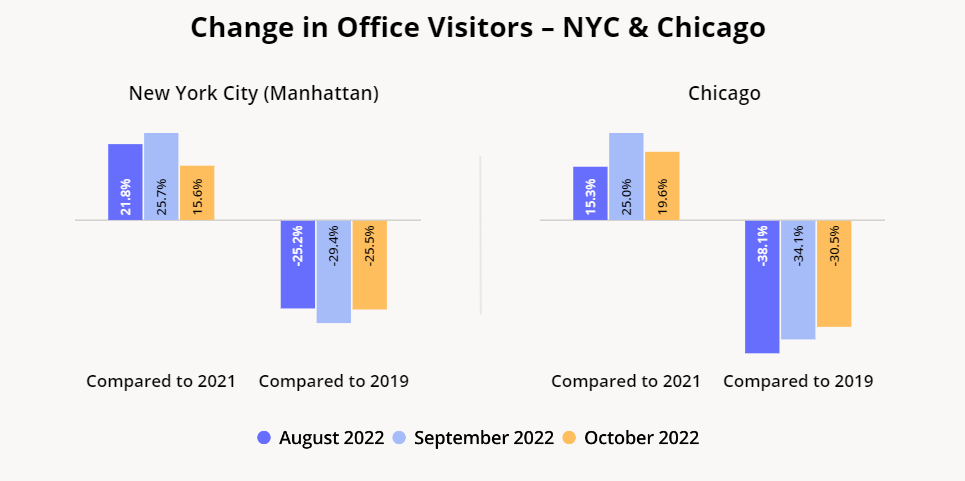
Zooming into Office Visitor Recovery
Indeed, zooming into the office visitor recovery by analyzing numbers of individual visitors, in addition to looking at visits as a whole, can provide a more complete snapshot of the current state of the workplace recovery.
In both Chicago and New York City, the Yo3Y visitor gap shrunk in October when compared to September – from 29.4% to 25.5% for New York, and from 34.1% to 30.5% for Chicago – even as the Yo3Y visit gap increased. So while more unique visitors went into the office in October, average office visit frequency decreased, which led to a widening of Yo3Y visit gaps along with a narrowing of Yo3Y visitor gaps.
The difference between the Yo3Y visitor trends and the Yo3Y visit numbers seems to indicate that many workers and employers are still figuring out how to make the hybrid model work for them. Individuals who were coming in three days a week may have gone down to two days a week, while others who had continued working fully remote may now be going in a couple of times a month. As companies continue settling into the new normal and the temperatures continue to drop, the office recovery may enter a new phase – more people visiting the office, but doing so less frequently.
To learn more about the data behind this article and what Placer has to offer, visit https://www.placer.ai/.


Sign up to receive our stories in your inbox.
Data is changing the speed of business. Investors, Corporations, and Governments are buying new, differentiated data to gain visibility make better decisions. Don't fall behind. Let us help.


Sign up to receive our stories in your inbox.
Data is changing the speed of business. Investors, Corporations, and Governments are buying new, differentiated data to gain visibility make better decisions. Don't fall behind. Let us help.