
The Placer.ai Nationwide Office Building Index: The office building index analyzes foot traffic data from 800 office buildings across the country. It only includes commercial office buildings and commercial office buildings on the first floor (like an office building that might include a national coffee chain on the ground floor). It does NOT include mixed-use buildings that are both residential and commercial.
The workplace recovery has stalled over the past few months, with employees and employers settling into the new normal of widespread hybrid and remote work. Now, with 2022 almost behind us, we dove into office foot traffic data for the past six months to understand where the workplace recovery stands nationwide and in select cities and what may impact the recovery in 2023.
Majority of Office Workers Now Back in the Office
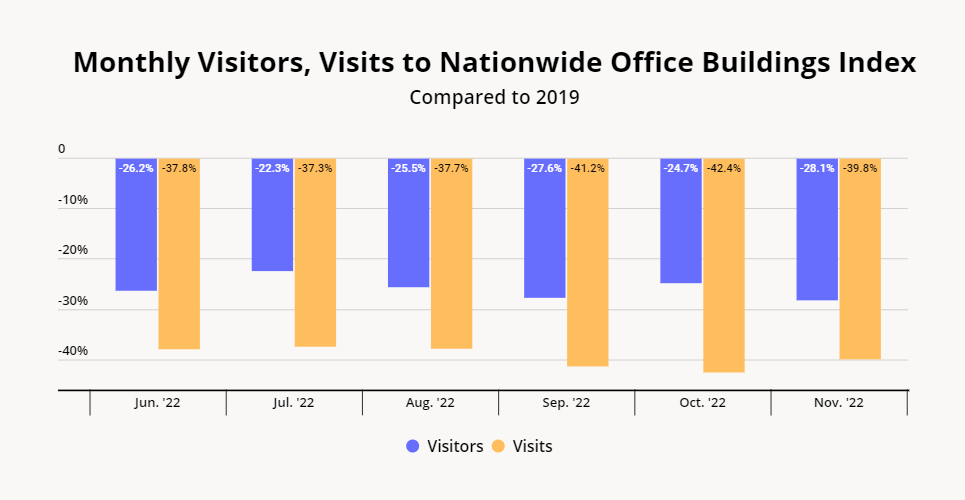
To get a clearer picture of the state of the workplace recovery, we analyzed both visit and visitor levels over the past six months. Monthly visitors refer to the number of individuals in a given month who entered one of the office buildings in the Placer.ai Nationwide Office Index and stayed a minimum length of time. Visits refer to the total number of visits that month – so one visitor can account for multiple visits.
Between June and November 2022, the monthly year-over-three-year (Yo3Y) visit gap to the Placer.ai Nationwide Office Building Index ranged from 37.3% to 42.4%, while the Yo3Y visitors gap ranged from 22.3% to 28.1%. So although almost three-quarters of pre-pandemic office visitors are back in the office in some capacity, office occupancy is still only at around 60% – which reflects an average of three in-office days a week for every office visitor.
Staying Close to Late 2021 Levels
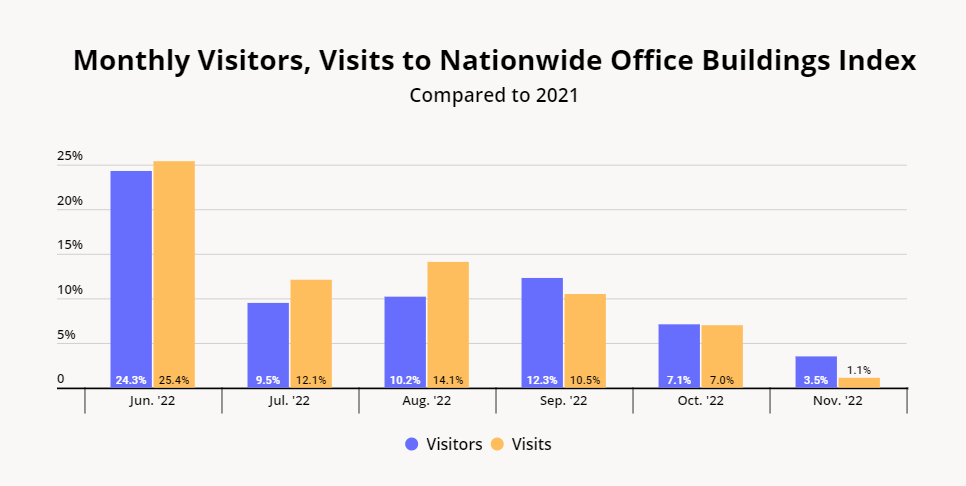
The differences between visitor and visit levels are also apparent when looking at the data on a year-over-year (YoY) basis. Between June and August 2022, the YoY increase in visits outpaced the YoY increase in visitors. So not only were more people going to the office than during the summer of 2021 – many of these workers were also going in more often. But since September, the situation has flipped, and the YoY increase in visitors outpaced the increase in employees. This means that, between September and November 2022, the average office worker went into the office fewer times a month than in the equivalent month in 2021. November 2022, for example, saw a 3.5% increase in visitors but just a 1.1% increase in visits relative to November 2021.
The YoY and Yo3Y data indicates that – even if more people are now working from the office on occasion – an increase in monthly office visitors is not enough to bring about a full workplace recovery. While some employees may still be transitioning from fully remote to hybrid work and begin coming in to meet clients or participate in larger meetings – the increase in occasional office dwellers will not necessarily have a significant impact on overall office occupancy rates.
Are Shifts in Internal Migration Impacting Regional Office Recovery Patterns?
Still, there are many factors that can influence the workplace recovery, and the fact that office recovery rates have plateaued in recent months does not necessarily mean that the patterns seen in late 2022 will continue into 2023. One of these open questions is the impact of continuing internal migration shifts on office occupancy in major cities.
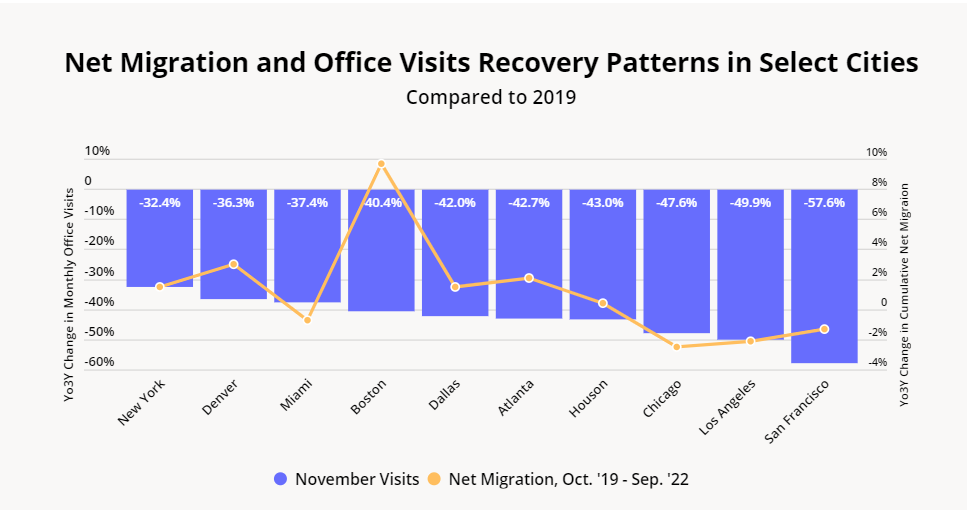
To assess the future effect of migration on workplace recovery, we analyzed how the shifts in migration over the past three years have already impacted office foot traffic across various cities. In the chart below, the blue bars represent Yo3Y November visits to 10 city-specific office indexes. The yellow line represents the change in county-level net migration for these 10 cities between October 2019 and September 2022.
The chart indicates that there is a sort of loose correlation between migration trends and workplace recovery rates – especially on the extreme ends of the spectrum. Chicago (Cook County), Los Angeles, and San Francisco, which over the past three years experienced the largest drop in migration of the 10 cities analyzed, have also seen the slowest office visit recovery. New York (Manhattan) and Denver, on the other hand, have seen both positive Yo3Y migration and relatively small Yo3Y visit and visitor gaps.
But for most cities towards the middle of the office recovery spectrum, migration patterns did not seem to have much of an impact on office visit levels. For example, migration to Suffolk County, MA (Boston) jumped almost 10% since October 2019, but its Yo3Y office foot traffic remained below that of Miami, which saw net negative migration flows over the past three years. Dallas, Atlanta, and Houston have all seen similar Yo3Y office visit rates, but differing net migration increases (1.5%, 2.1%, and 0.4%, respectively).
According to a recently released report, the newfound ability to work remotely is driving millions of Americans to leave crowded urban centers and relocate to more affordable areas that are beyond regular commuting distances (two hours or more). But as the current data indicates, even large shifts in migration will not necessarily translate to a significant impact on local office occupancy.
To learn more about the data behind this article and what Placer has to offer, visit https://www.placer.ai/.


Sign up to receive our stories in your inbox.
Data is changing the speed of business. Investors, Corporations, and Governments are buying new, differentiated data to gain visibility make better decisions. Don't fall behind. Let us help.


Sign up to receive our stories in your inbox.
Data is changing the speed of business. Investors, Corporations, and Governments are buying new, differentiated data to gain visibility make better decisions. Don't fall behind. Let us help.