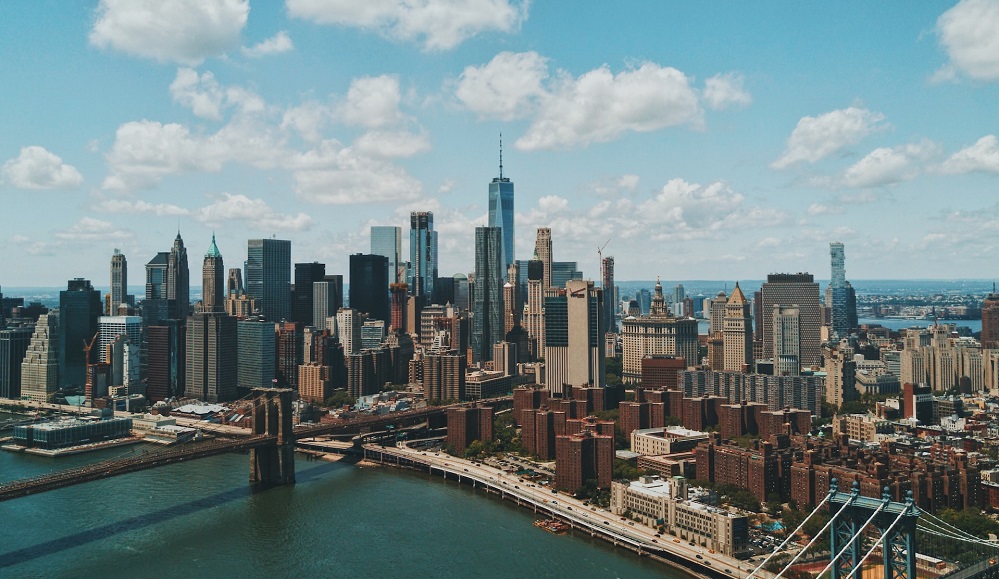
Top-line performance recovery was aplenty around the U.S. in 2022 as record-breaking levels of demand were combined with strong pricing power in an inflationary setting. Among the recovery highlights, New York City made a phenomenal comeback to grab the nation’s top spot in revenue per available room (RevPAR), while smaller hotel destinations with a primary focus on high-end travelers also found significant levels of success for the year.
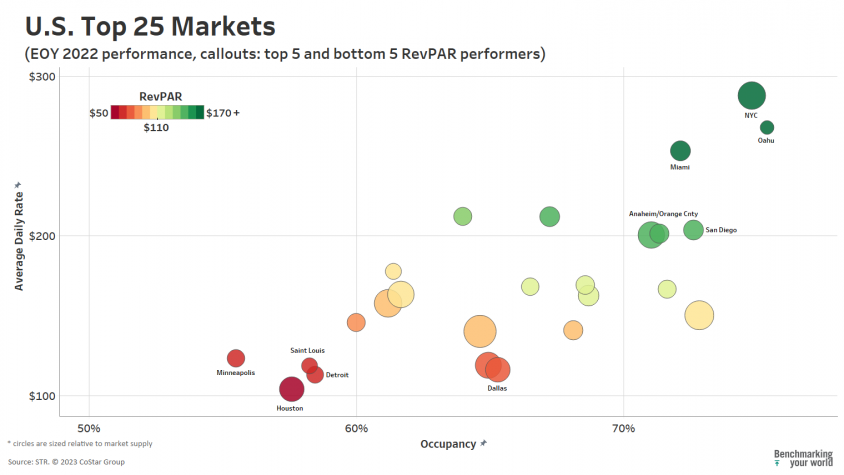
Overall, New York City’s nominal RevPAR (non-inflation adjusted) for 2022 led the Top 25 Markets at $215. That level was down $4 from 2019 but up 72% year over year. Rounding out the Top 25 Market leaders were Oahu (+61% from 2021 to $202), Miami (+23% to $183) and San Diego (+45% to $148). Even the lowest RevPAR performers from the Top 25 group experienced notably positive lifts from the prior year, including Houston (+20% to $60), Detroit (+25% to $66), Minneapolis (+53% to $68), St. Louis ( +32% to $69) and Dallas (+35% to $76). Demand levels in 2022 were higher than 2019 for six of the Top 25 Markets, including Miami and Dallas.
Compared to 2019, NYC’s total-year performance was down in demand (-13%) and occupancy (-10.1 percentage points) from 2019. However, that end-of-year telling of the market’s performance does not completely reveal (or revel in) New York City’s strong hand in play at end of the year. Starting in April, NYC began to rally from a slow, Omicron-impacted first quarter to take top position among large markets. By September, the Big Apple was in the lead position with real RevPAR of $280, which was driven by an enviable ADR of $345 and a healthy four-month average occupancy of 83.0%. By comparison, the distant second-best large market during that period, Oahu, had $204 RevPAR, $273 ADR, and 73.2% occupancy. A variety of factors contributed to NYC’s fourth-quarter resurgence, including a continued strong showing in domestic leisure demand, but also an influx of international travelers along with the rebooting of business travel to the market.

Compared to 2019, NYC’s total-year performance was down in demand (-13%) and occupancy (-10.1 percentage points) from 2019. However, that end-of-year telling of the market’s performance does not completely reveal (or revel in) New York City’s strong hand in play at end of the year. Starting in April, NYC began to rally from a slow, Omicron-impacted first quarter to take top position among large markets. By September, the Big Apple was in the lead position with real RevPAR of $280, which was driven by an enviable ADR of $345 and a healthy four-month average occupancy of 83.0%. By comparison, the distant second-best large market during that period, Oahu, had $204 RevPAR, $273 ADR, and 73.2% occupancy. A variety of factors contributed to NYC’s fourth-quarter resurgence, including a continued strong showing in domestic leisure demand, but also an influx of international travelers along with the rebooting of business travel to the market.

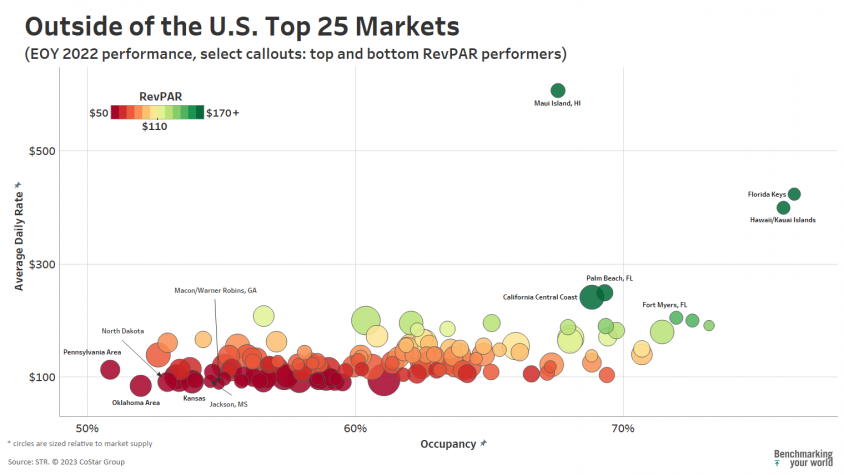
Outside of the Top 25 Markets, the year’s leading RevPAR markets primarily catered to high-end, luxury-oriented travelers, including Maui (+26% YOY to $410), the Florida Keys (+5% to $323), Hawaii/Kauai Islands (+53% to $303), Florida’s Palm Beach (+32% to $172) and the California Central Coast (+17% to $166). On an annualized real (inflation-adjusted) RevPAR basis, all of the top labeled markets were substantially outpacing their RevPAR returns of 2019. Among the labeled set, the Florida Keys had the best annualized RevPAR returns (35%) against 2019 levels which occurred despite demand disruptions stemming from Hurricane Ian in September. On the downside, the lowest performing markets had real annual RevPAR indices slightly under pacing their 2019 levels, but those margins were in a narrow band (-4% to -1%) modestly below “normal” levels from 2019
Despite autumn’s strong rebound to both large and non-Top 25 Markets, the range of indicators at the close of 2022 demonstrate both the progress made against a dreary 2020 but also the considerable remaining goals to match 2019 benchmark levels. Annual room demand in 67 of 166 (40%) STR-defined U.S. markets in 2022 underperformed 2019 levels. After accounting for supply growth, that indicator drops to 50 markets (30%) that experienced higher average occupancy compared to 2019. The good news is that 143 markets this past year had ADR growth that met or beat annual inflationary increases (annualized at 8.0% between 2022 and 2021). If we benchmark the recent dollar value against 2019 (a 14.4% increase), however, only slightly more than half of U.S. markets (89 of 166) had ADRs surpassing 2019. With modestly less favorable occupancy performance last year, annual real RevPAR in 2022 was better than 2019 for only 42% of U.S. markets.
ADR gains into 2023 are expected to continue though at a more modest pace than 2022. Leisure demand patterns continue to remain strong with the group sector marking major returns, particularly in large markets.
To learn more about the data behind this article and what STR has to offer, visit https://str.com/.


Sign up to receive our stories in your inbox.
Data is changing the speed of business. Investors, Corporations, and Governments are buying new, differentiated data to gain visibility make better decisions. Don't fall behind. Let us help.


Sign up to receive our stories in your inbox.
Data is changing the speed of business. Investors, Corporations, and Governments are buying new, differentiated data to gain visibility make better decisions. Don't fall behind. Let us help.


