
U.S. performance
U.S. hotel industry occupancy bounced back in the week after the MLK holiday, reaching 56.3%. That level was up 6.8 percentage points (ppts) from a year ago and just 1.5ppts below the comparable week in 2019. Moreover, the week’s level was the eighth highest ever recorded for the last full week of January—the highest occupancy (58.4%) was posted in 2006. Even better, room demand was the second highest for the week and just 25,000 nights short of the record seen in 2020. Month to date through 28 January, occupancy was 53.1%, which was the eighth best of the past 24 years with the highest level (54.6%) seen in 2017, suggesting that 2023 is shaping up to be a somewhat normal January. Like with the weekly result, MTD demand was the second highest, again behind 2020.
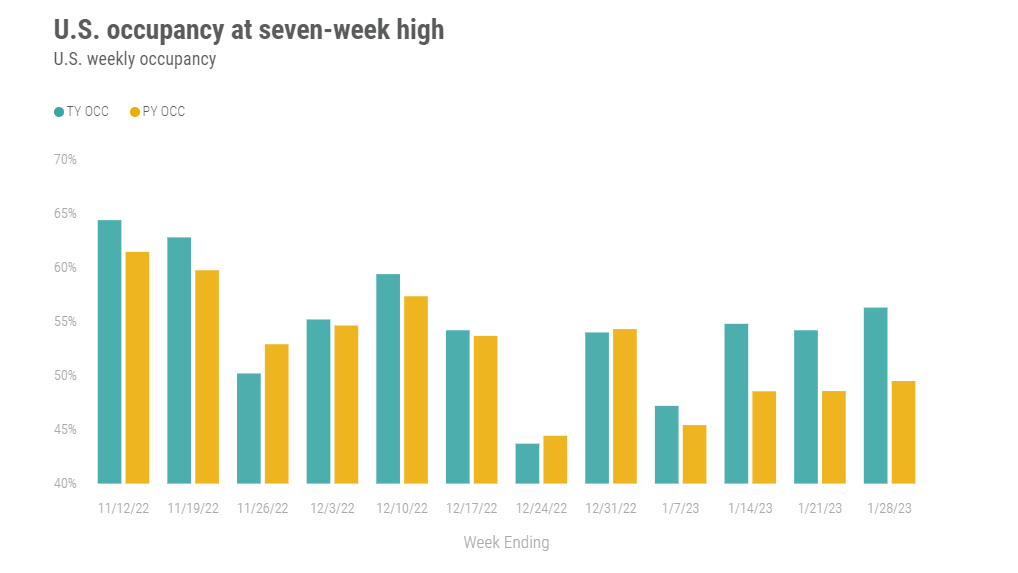
Occupancy (63.1%) in the Top 25 Markets reached a seven-week high but was well off the volume seen in 2018 (70.3%). The gap to 2018 was substantial in nearly all of the Top 25 Markets, most notably in San Francisco, which was 23ppts behind its 2018 occupancy. Las Vegas, Chicago, Seattle, Los Angeles, and Houston all had double-digit gaps to that year. The occupancy deficit to 2019 for the Top 25 Markets was much less (-5.1ppts) versus 2018. The markets with the largest gaps to 2018 also had the largest deficits from 2019.
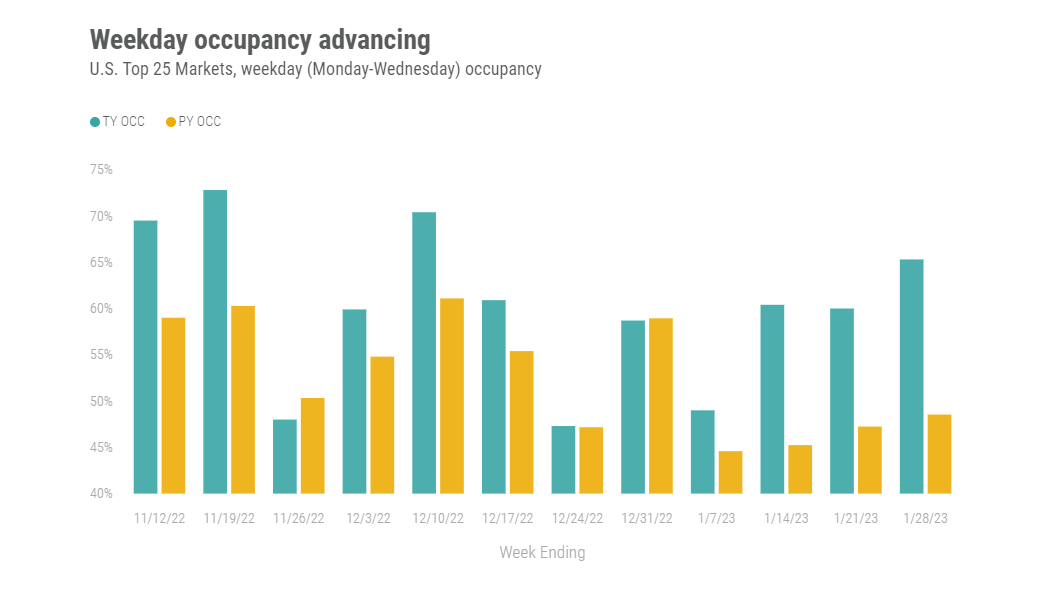
Weekday occupancy in the Top 25 Markets reached 65.3%, up 5.3ppts from a week ago and 16.8ppts higher than in 2022. As compared to 2019, Top 25 occupancy was 4.1ppts lower. While a majority of the Top 25 Markets are at a deficit to 2019, nine of the markets outperformed this week, including Phoenix (87.9%), San Diego (78.2%), Atlanta (76.9%), and Washington, D.C. (65.6%). These markets, among others, benefited from strengthening group business, which reached a 7-week high. The impact of improving group and business travel was also evident in the chain scales as Upper Upscale and Upscale neared 70% occupancy for weekdays with Luxury at 67%. Room demand (weekday and full week) for Upscale reached a 24-year high for the period as did Upper Midscale. Luxury and Upper Upscale had their 5th highest room demand ever for the concluding week of January.
Non-Top 25 Markets saw weekday occupancy of 54.5%, which was favorable to prior years. For the full week, occupancy in these markets collectively attained 52.6%, the third highest for the last week of January going back to 2000.
Besides firming weekday occupancy, weekend occupancy across the U.S. was solid at 59.9% and only slightly behind 2019 (60.4%), which was the best level recorded for this specific week. The Top 25 Markets saw weekend occupancy of 66.2%, which was 3.4ppts behind 2019, whereas occupancy in the remaining markets reached 56.5%, the highest ever recorded among comparable weeks. Daytona Beach led the nation with the highest weekend occupancy (89.8%), boosted by Rolex 24 at Daytona. Occupancy will spike again in a few weeks for the Daytona 500, as shown in our Forward STAR data. Nine of the top 10 highest weekend occupancies were in Florida. Tucson was the lone exception. Orlando (79.4%), the second largest market in the U.S., was also in the top 10 this week.
Average daily rate (ADR) advanced 1.7% week over week to US$143, which was 15.9% higher than a year ago. All but five markets reported year-over-year growth. The Florida Keys saw the largest decrease (-9.5%) with its ADR remaining above US$400 and 47% higher than in 2019. In the Top 25 Markets, ADR increased 20.5% YoY, led by Dallas (+36.3%), with Las Vegas, Washington, D.C., and Orlando seeing YoY gains of more than 28%. Maui continued to lead the nation in ADR (US$597), up 12.1% YoY indicating leisure destinations still have pricing power.
MTD real (inflation-adjusted) ADR and RevPAR remained at a deficit to 2019 with the former at -4.5% and the latter -6.3%.
Global Performance
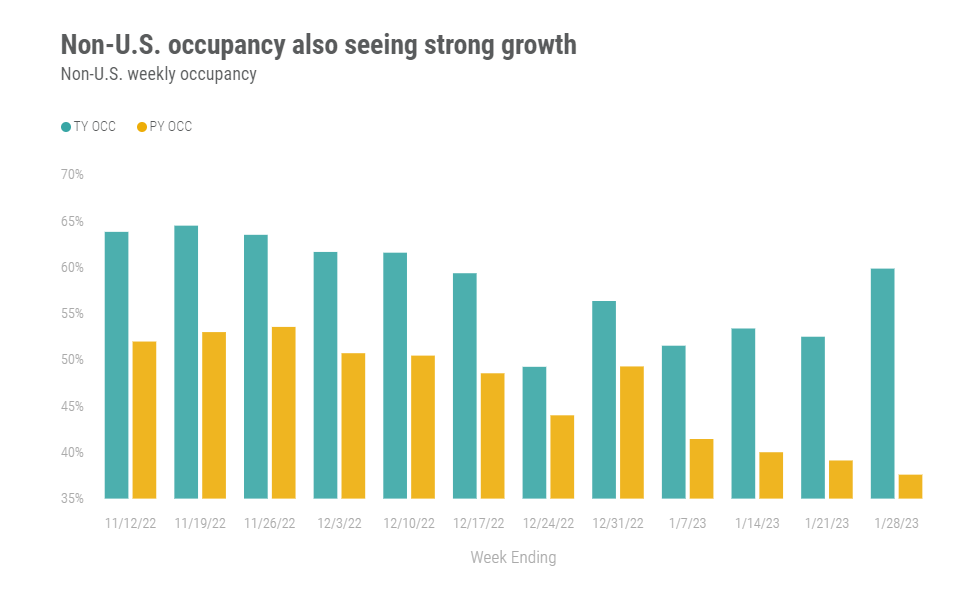
Global occupancy (excluding the U.S.) increased 22.2ppts YoY to 59.9%, which was the highest level of the past seven weeks and 7.4ppts higher than the previous week. ADR increased 35.5% YoY with every country except six posting growth. The Caribbean (72.6%) showed the week’s highest occupancy followed by the Middle East (71.3%) and Central and South Asia (70.3%). For the second straight week, Barbados had the highest occupancy at 81%, however, it was one of the five countries to see a drop in YoY ADR this week (-15.4%).
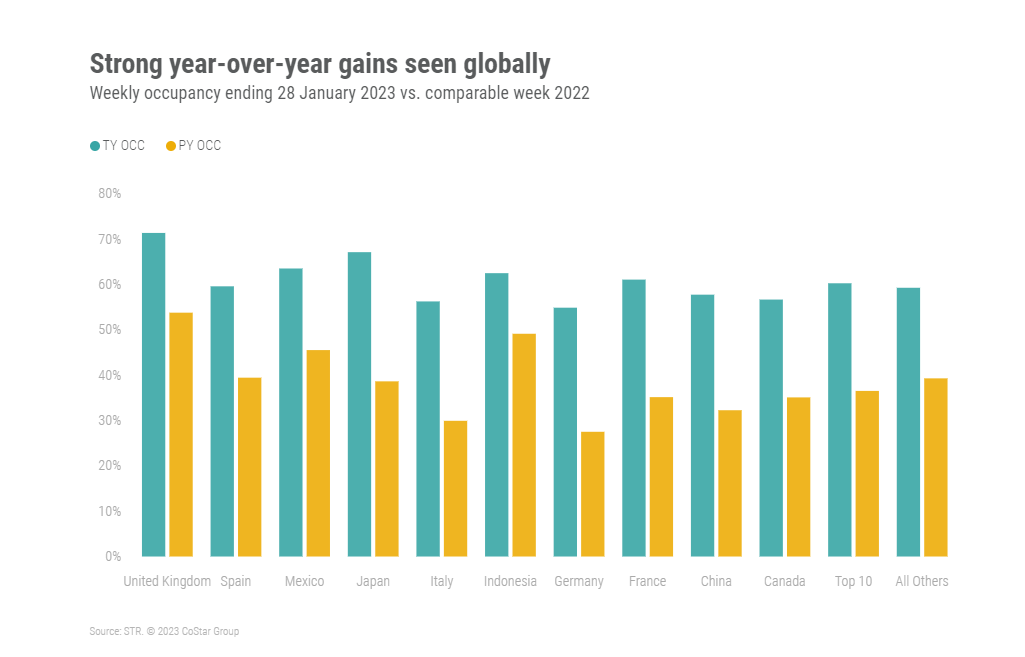
Occupancy in the top 10 countries, based on supply, reached 60.2%, up 9.5ppts from a week prior and 23.7ppts from a year ago. For the third consecutive week, the United Kingdom had the highest occupancy (71.3%) among the top 10, up 3.2% week over week. Germany had the lowest occupancy (54.9%) for the week, but its level was 27.4ppts higher as compared to a year ago.
The United Kingdom has seen significant economic issues due to high inflation and increasing interest rates, but demand for hotels continued to increase week on week and year on year. As compared to a year ago, U.K. occupancy rose 17.6ppts. London occupancy hit 71.3%, up 28ppts from a year earlier and 3.6ppts from the prior week. Outside of London, occupancy was slightly lower 71.1% and ranged from 82.4% in Leeds to 57.7% in Northern Ireland. With the exception of Northern Ireland and Liverpool, occupancy in U.K. markets was above 65% with all markets seeing year-on-year growth and all but five posting week-on-week gains. All markets, except two, also posted year-on-year ADR gains with the measure up 26.6% from a year ago.
January MTD occupancy for non-U.S. countries stood at 54.3% with a 6.1ppts gap to 2019 but up 14.5ppts from a year ago. ADR advanced 32.1% from its MTD level in 2022.
Final thoughts
The month of January seems much more normal than previous months. While still at a deficit, the U.S. Top 25 Markets are strengthening on the back of stronger group and business demand. The same appears to be happening outside the U.S., where economic headwinds don’t appear to be hampering demand. Erosion in leisure demand and ADR also appears to be limited. While we are still early in the year, and economic barriers remain significant, the month and quarter are on track for significant growth.
Looking ahead
Looking ahead and in the U.S., the week ending 4 February will likely see weaker occupancy and stable ADR based on previous history. Early U.S. performance data is also tracking in that direction. Outside the U.S., performance will likely strengthen given the travel restrictions brought about by Omicron a year ago. Overall, hotel demand looks solid despite economic uncertainty.
To learn more about the data behind this article and what STR has to offer, visit https://str.com/.


Sign up to receive our stories in your inbox.
Data is changing the speed of business. Investors, Corporations, and Governments are buying new, differentiated data to gain visibility make better decisions. Don't fall behind. Let us help.


Sign up to receive our stories in your inbox.
Data is changing the speed of business. Investors, Corporations, and Governments are buying new, differentiated data to gain visibility make better decisions. Don't fall behind. Let us help.