
Source: https://www.corelogic.com/blog/2020/6/loan-to-value-ratios-in-retrospect-a-lookback-on-2019.aspx
The housing market collapse of 2008 and 2009 underscored the importance of keeping a watchful eye on combined loan-to-value (CLTV)—a ratio of all secured loans on a property to the value of the property. Lenders use the CLTV ratio, along with other calculations, to determine the risk of extending a loan to a borrower.
Reading Between the Ratios: Adjusting for Home-price Appreciation
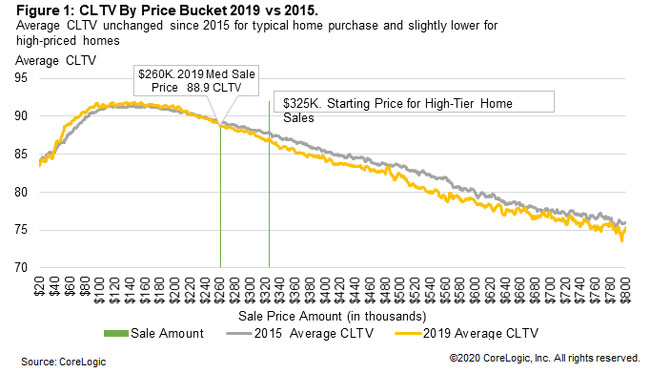
An analysis of the CLTV ratio, by price bucket, shows that homebuyers in 2019 borrowed more for homes in the same price range than they did in 2015.[1] The median home price in 2019 for mortgaged home sales was roughly $260,000, with an estimated average CLTV of 89%. Conversely, in 2015, homebuyers averaged a CLTV of 88% for homes when spending the same amount.
However, adjusting for home-price appreciation shows CLTVs at the low end haven’t changed much. Between 2015 and 2019, the median sale price grew by 17%. While in 2015, purchase mortgages at the median sale price had roughly the same average CLTV as those sold around the median price in 2019. By accounting first for home-price appreciation, we can provide a fair comparison of the average CLTV by price bucket.
2019 vs. 2015: Existing Homeowners Take Advantage of Home Appreciation
When 2015 median sale price amounts are adjusted to consider 2019 home appreciation, the average CLTV for homes sold was approximately the same in both years.[2] For high-tier home sales, those with a sale price amount equal to or exceeding 125% of the national median, the CLTV in 2019 averaged about 1 percentage point less than in 2015 [see figure 1]. Nationwide home values grew an average of 22% between 2015 and 2019, possibly contributing to the improvement in CLTV for high end home purchases.[3] Homebuyers selling an existing home in 2019 would likely have benefited from increases in home equity, resulting in additional funds to put towards a down payment on the new home.
Consider the Whole Pie: The Hidden Risks in 2005
Before the housing bubble peak in the mid-2000s, we observed 2019 homebuyers borrowed more than in 2005 when purchasing around the median sale price amount. After accounting for home price changes, the average CLTV in 2019 was about 1.5 percentage point higher than in 2005. [4] While this metric may suggest tighter lending standards in 2005 for mid-tier home sales, the lower CLTV was offset by the risky loan practices prevalent at the time. For example, CoreLogic public record data shows the 2005 Adjustable Rate Mortgage (ARM) share at 47%, compared to just 4% in 2019, and balloon mortgage share at 8%, compared to 0% in 2019. According to CoreLogic TrueStandings, which provides instant access to online loan performance tools, the average credit score was lower, and low/no-doc loans— loans that do not require borrowers to provide documentation of their income to lenders—were more prevalent in 2005 than in 2019. Furthermore, Figure 2 shows the average 2005 CLTV begins to exceed the 2019 average in high-tier home sales, with the gap widening with each increasing price bucket.

In the End Consider the Highs and Lows of CLTV
In recent years we’ve seen a steady pattern of higher CLTV ratios within low-end purchases markets and a steady CLTV decrease as the home becomes more expensive. The pattern could be in part due to lower-priced entry-level homes being sold to buyers without established home equity to help with a down payment. Alternatively, it could be a result of higher-end homes being purchased by existing homeowners looking to trade up. After adjusting for changes in home price growth, there has been very little change in the average CLTV by price bucket except for a slight decline with higher-end sales. That said, any change in the overall average CLTV may provide initial insight into the buyer mix and risk tolerance of lenders.
To learn more about the data behind this article and what CoreLogic has to offer, visit https://www.corelogic.com/.


Sign up to receive our stories in your inbox.
Data is changing the speed of business. Investors, Corporations, and Governments are buying new, differentiated data to gain visibility make better decisions. Don't fall behind. Let us help.
Sign up to receive our stories in your inbox.
Data is changing the speed of business. Investors, Corporations, and Governments are buying new, differentiated data to gain visibility make better decisions. Don't fall behind. Let us help.