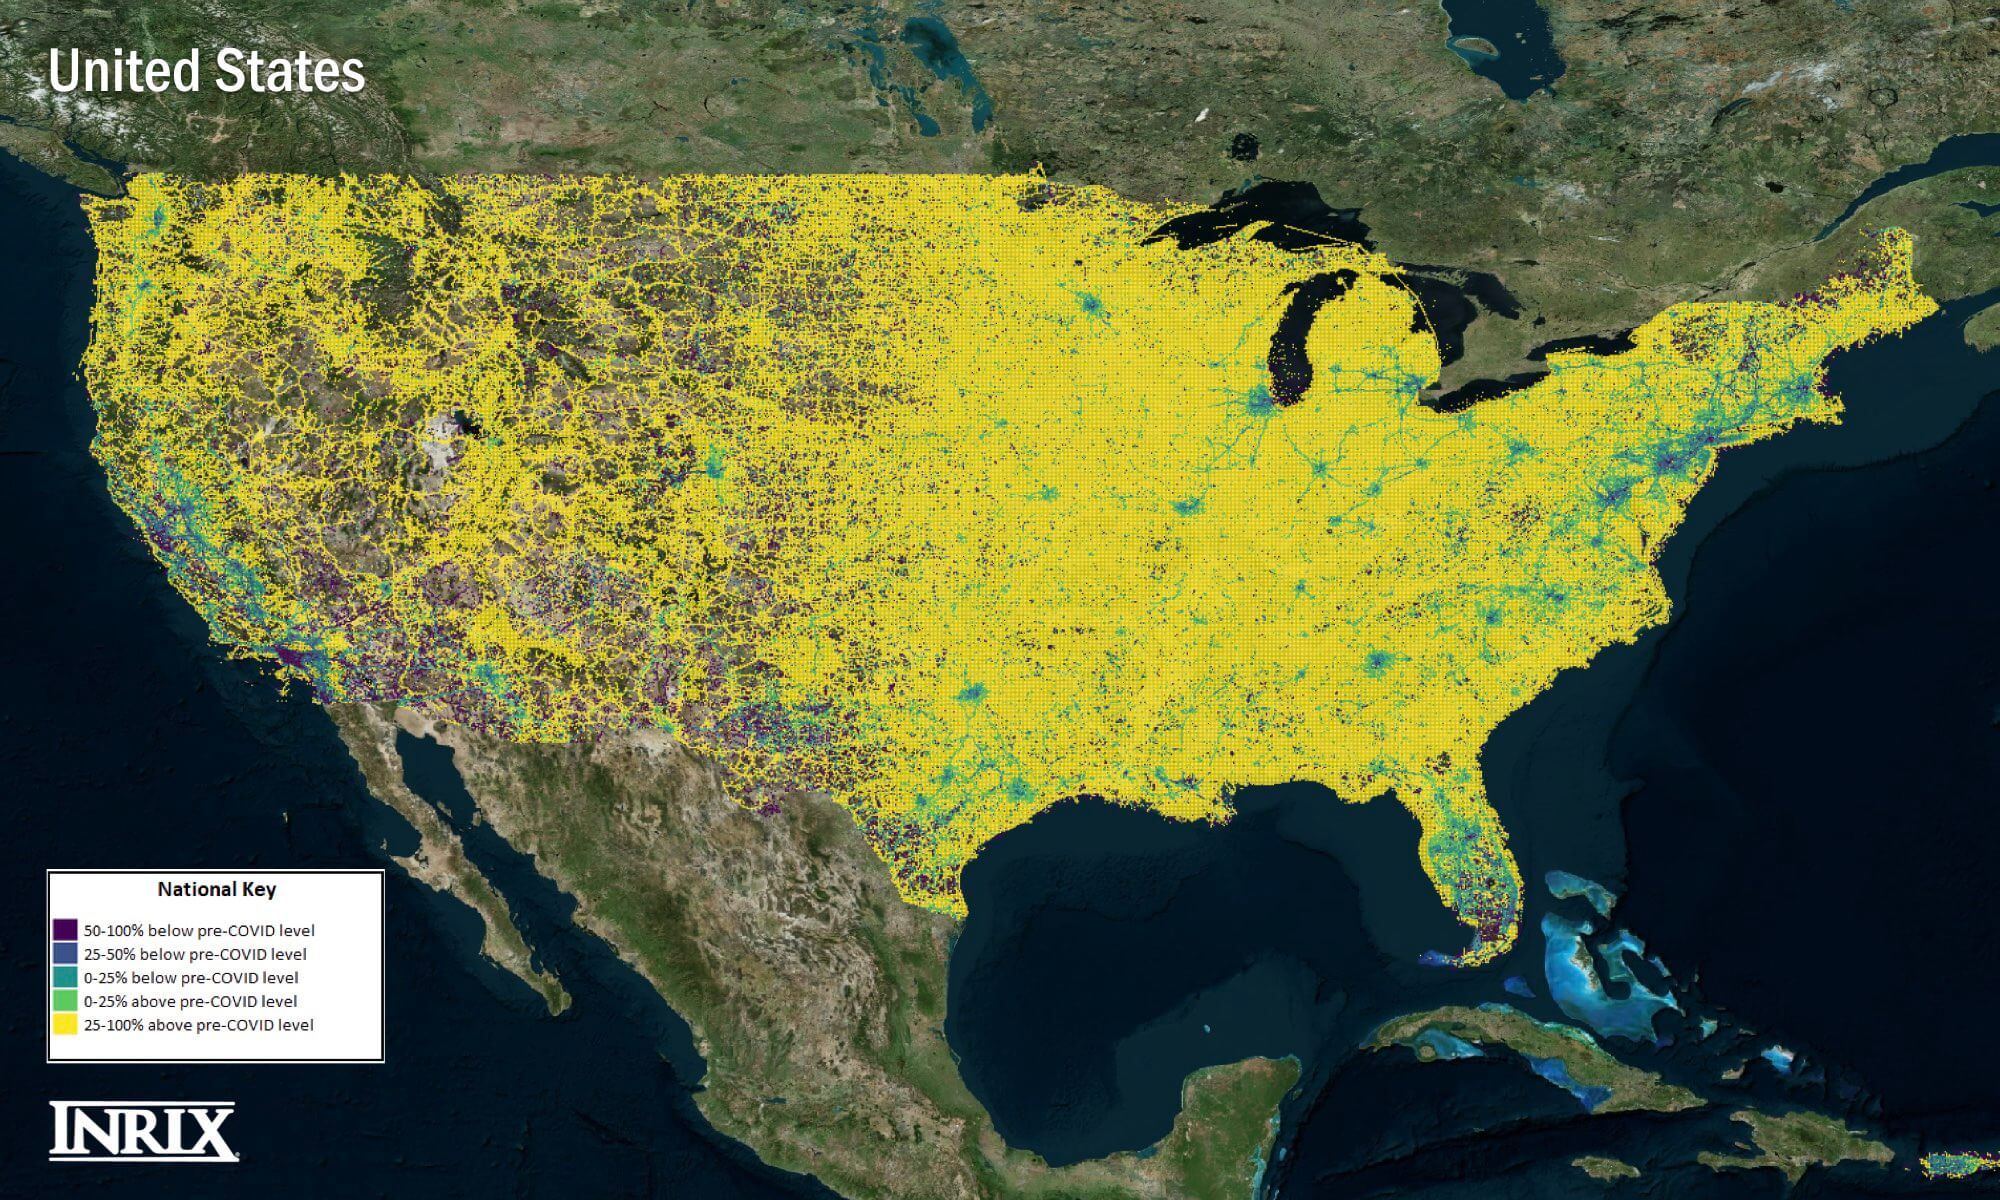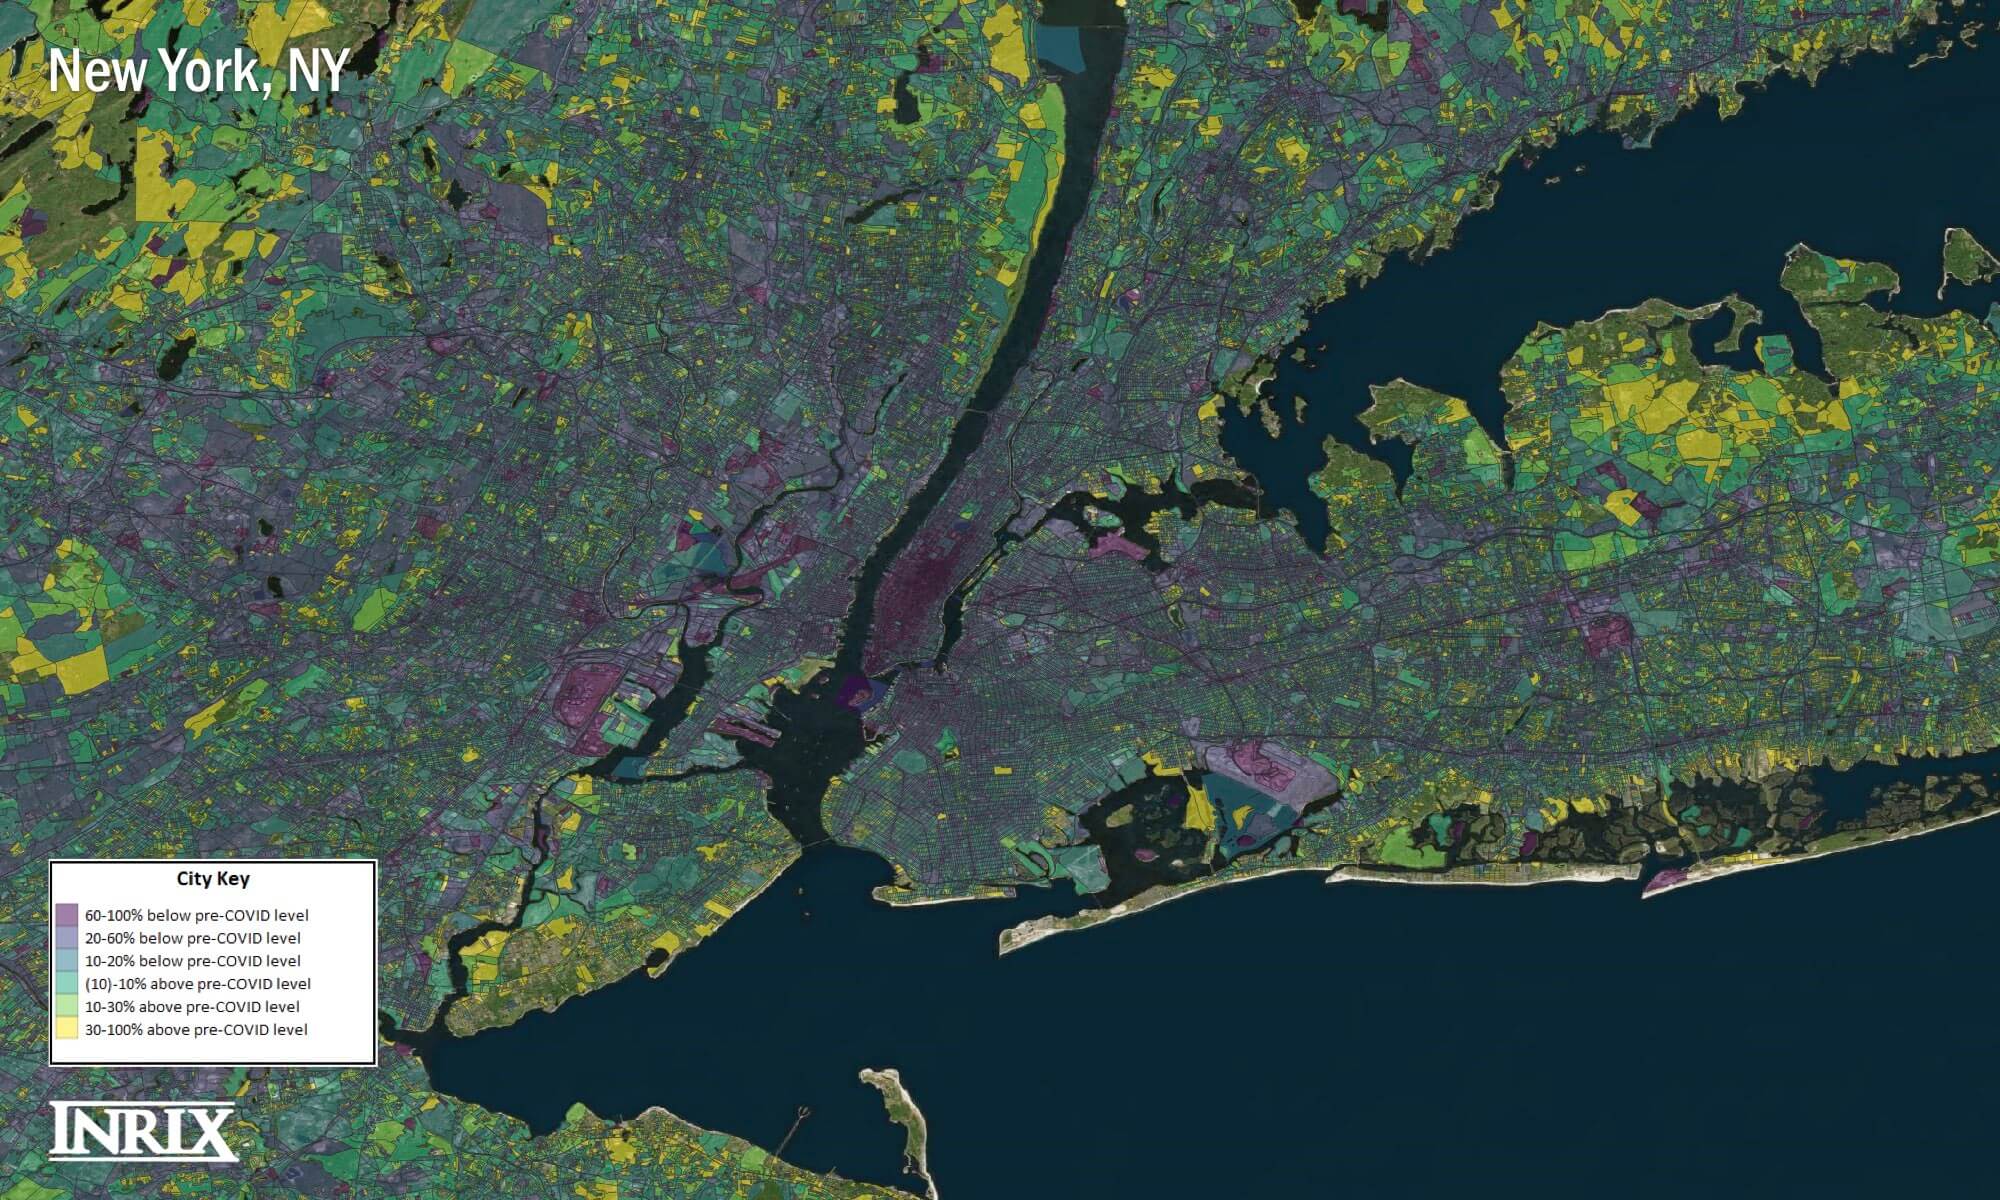
As governments at all levels across the country ease restrictions relating to COVID-19, INRIX continues to monitor activities across the United States. We have focused specifically on a few main areas: vehicle miles traveled, trips, traffic speeds and re-emergence, the increase in access for residents by all modes of travel.
Our re-emergence maps are a visual that allows people to see how their city is coming back from COVID shutdowns. You can see our latest images and transportation analysis, here: https://inrix.com/covid-19-transportation-trends/

To drill further this week, INRIX has highlighted a couple “points of interest” (or POIs). These places are on the front lines of re-emergence, as most governments have allowed increases in elective medical procedures, parks have opened up and restaurants are allowed to open under capacity restrictions. This insight provides business owners, public agencies and the general public with key information to make informed decisions.
For example, a city considering opening up public right of way to restaurants can gauge program effectiveness. Someone interested in opening a retail site can assess traffic to and from zones they are considering, and those planning bus routes can see where people are accessing goods and services during this recovery.
Table: Increase in weekday, daytime trips to zones that contain medical facilities, parks and restaurants:

The table above provides a unique look at a handful of regions across the country, analyzing trips to census blocks that contain POIs. A Census Block typically contains multiple POIs, like multiple restaurants, making it a challenge to determine which business was visited. So, to get a more accurate picture, we only analyzed zones that have the largest concentrations of that of POI.
In Washington DC, trips to Census Blocks with medical facilities increased 30 percent over the week prior, while trips to zones containing a high-density of restaurants increased 44 percent. In contrast, trips to parks in Seattle saw a 24 percent increase week to week.
It’s important to realize that, while these increases may seem relatively large, they are based off of a lower, post-COVID shutdown number. In addition, we would expect to see large increases from pre-COVID levels with seasonal change in key places like parks and restaurants.
To learn more about the data behind this article and what Inrix has to offer, visit https://inrix.com/.


Sign up to receive our stories in your inbox.
Data is changing the speed of business. Investors, Corporations, and Governments are buying new, differentiated data to gain visibility make better decisions. Don't fall behind. Let us help.


Sign up to receive our stories in your inbox.
Data is changing the speed of business. Investors, Corporations, and Governments are buying new, differentiated data to gain visibility make better decisions. Don't fall behind. Let us help.