Source: https://www.kinsahealth.co/kinsa-monitors-real-time-disease-transmission-to-inform-safe-re-openings/
Summary:
During the first COVID-19 wave, the absence of contact tracing, widespread testing, and community surveillance tools left communities with one blunt force approach to curb the spread of COVID transmission – social distancing. As social distancing regulations are relaxed across the country there is a real concern of case resurgence in the absence of concrete management plans, as seen in the June 2020 Arizona outbreak. Such examples of explosive case growth are preceded by periods of rapid, silent disease transmission, reflected in a disease’s effective reproductive number (Rt). With years of illness data available, Kinsa has created a tool to monitor unexpected changes in community disease transmission, atypical Rt. Atypical Rt tracks social distancing-driven changes in disease transmission exceptionally well and is poised to track the quality of future non-distancing-based interventions, such as contact tracing, to aid in safe community re-openings.
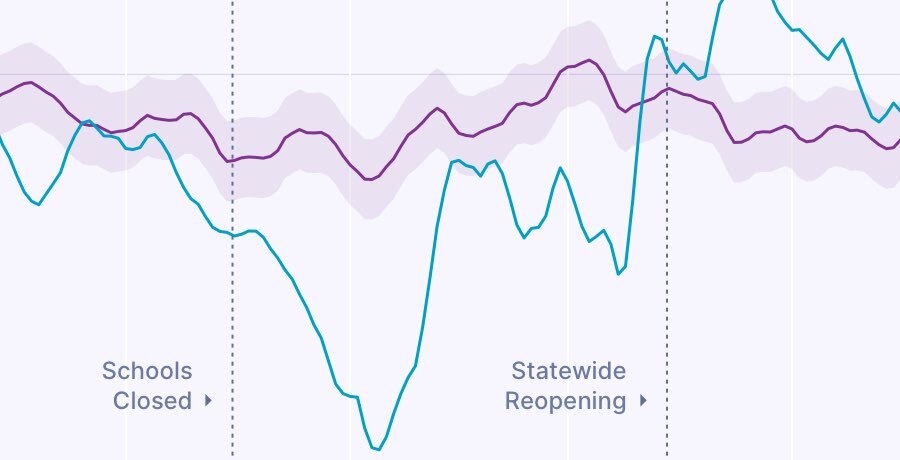
Kinsa’s Rt metrics accurately capture the changes in disease transmission that have occurred during the US lockdown and quarantine. For example in Arizona, we see a strong drop in disease spread following school closures and a strong increase to high disease spread when the shelter-in-place order was lifted on May 16th (Figure 1). These increases in Kinsa atypical Rt precede the COVID-19 resurgence in June, as Kinsa provides a more rapid indication of disease spread by monitoring all fever activity (including flu) and is not impacted by reporting delays and the delay between symptom onset and later hospitalization.
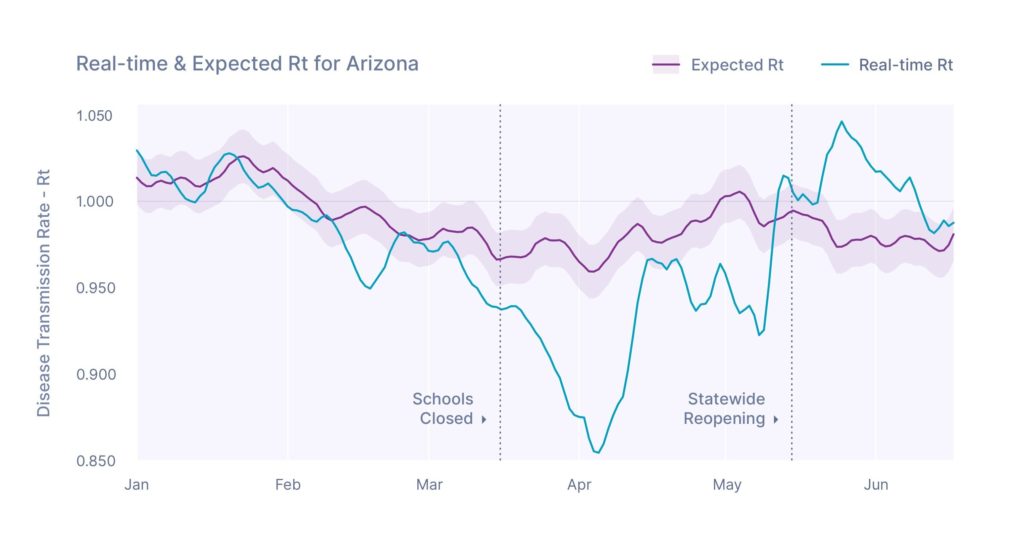
Figure 1: Kinsa real-time disease transmission compared to expected Rt for this time of year. We subtract out the expected Rt on a given day to estimate atypical Rt (see Figure 2 below). Periods of unexpectedly low Rt are observed, driven by social distancing in April (solid vertical line, followed by unexpectedly high transmission in May (dashed vertical line), coincident with re-opening and surges in COVID-19 case counts.
To calculate atypical Rt, we find the difference between Kinsa’s expected and real-time Rt, telling us when, where, and to what degree unexpected community disease spread is occurring. During a normal flu season, there are predictable seasonal changes in community disease transmission (expected Rt), and Kinsa is able to learn this from our years of hyper-local fever data. Our expected Rt trends are similar to what is found from influenza surveillance efforts, where Rt is above 1 during winter months and below 1 during the summer off-season. Rt is also commonly used to track the nature of a COVID-19 outbreak using case data, where values above 1 indicate an uncontrolled outbreak is likely, whereas values below 1 indicate an outbreak is less likely to grow (See COVIDActNow and rt.live). Kinsa Rt is differentiated from these approaches in that we track all community disease spread, outside of the healthcare system, via a nationwide network of smart thermometer users, reporting Rt for all US counties all of the time.
Kinsa atypical Rt is highly correlated with changes in mobility observed during the COVID-19 lockdown and recent re-opening. Overall, we observe strong correlations between atypical Rt and Apple driving routing requests across the continental US, where the mean correlation (r) between mobility data and atypical Rt is 0.83 across 48 states. These strong correlations are clear across time, where atypical Rt was unexpectedly low following social distancing directives, and we have seen a steady rise in Rt coincident with increasing mobility. This can clearly be seen across the country, where Apple’s driving trends decreased markedly in March and have slowly risen with the relaxation of distancing directives. We see similar patterns in Kinsa atypical Rt, where transmission rates were below average in April and have slowly risen to above average with relaxed distancing (Figure 2).
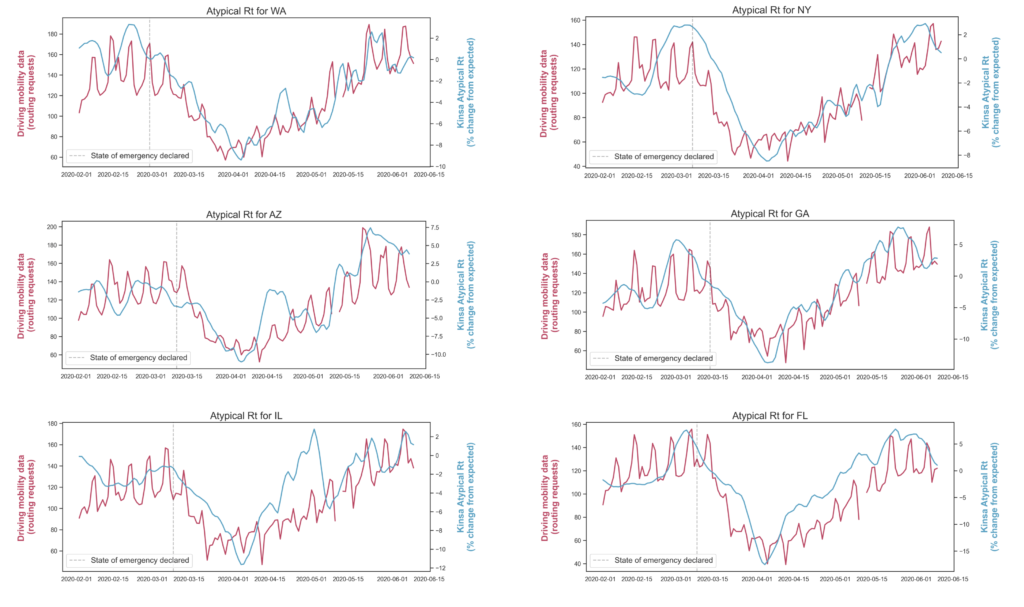
Figure 2: Apple driving routing requests (mobility; red) and Kinsa atypical Rt (blue) across multiple US states, including Arizona, Georgia, Florida, New York, Illinois, and Washington. We observed reductions in Rt coincident with reduced mobility, and Rt increases with human mobility. Mobility data is provided from Apple’s open-access data portal. Dashed vertical lines represent the date of state of emergency declarations in each state.
These strong correlations are expected, as social interaction is a direct driver of communicable disease transmission. This is why communities shuttered during the first COVID-19 wave; if we reduce contact, we can ‘flatten the curve’. These interventions have worked, where Kinsa observed marked reductions in disease transmission rapidly following school closures and shelter-in-place orders (link1; link2). Similar responses are observed in COVID-19 data, where reductions in mobility reduced COVID-19 transmission rates (link1; link2; link3), therefore re-opening presents a real risk of increasing spread.
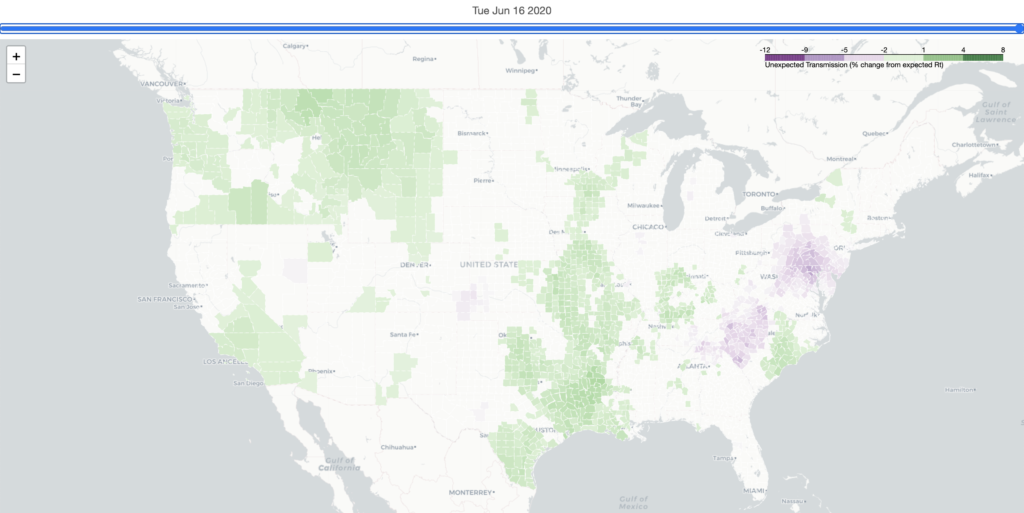
Figure 3: Map of atypical Rt across US counties, where purple regions have abnormally low transmission rates and green counties have abnormally high transmission rates. Abnormally high Rt is observed across the American West and Southeast, where steady to rising COVID case rates have been observed into the summer.
A real-time transmission metric, such as Kinsa atypical Rt, provides a direct means to rapidly and accurately monitor the impact of re-opening strategies. For example, today we are observing unexpectedly high Rt throughout the American West, South, and parts of the Northeast (Figure 3), in contrast to the beginning of April when Rt was below normal across the US during the height of social distancing and mobility restrictions (Figure 4). Kinsa atypical Rt is a three-week leading indicator of trends of COVID-19 Rt (Figure 5; r = 0.55 across 35 states), further demonstrating the power of this tool for monitoring the safety of reopening plans. COVID-19 Rt was calculated directly from state-level confirmed COVID case data, following a similar method to that outlined in our technical approach and used to calculate real-time Rt.
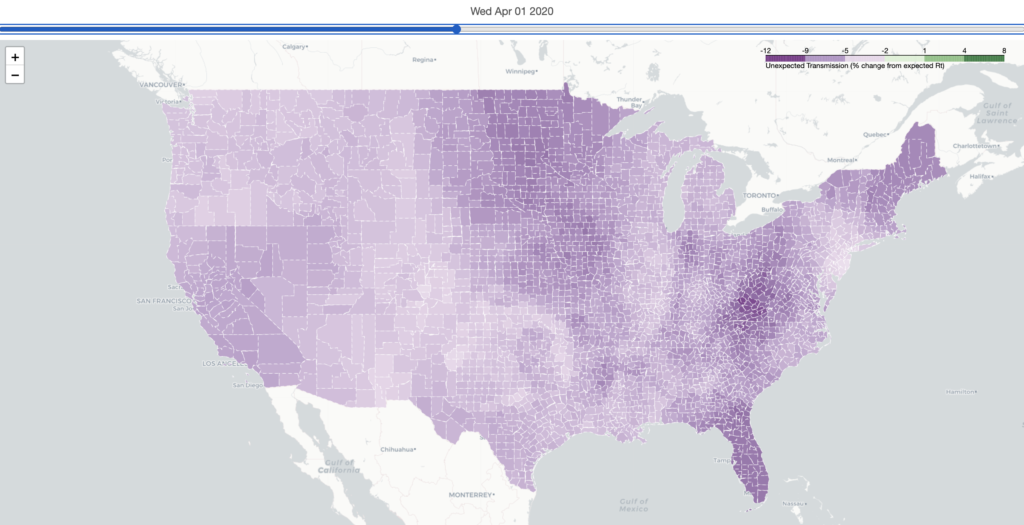
Figure 4: Map of atypical Rt across US counties, where purple counties have abnormally low transmission rates. During the peak of social distancing, transmission rates were well below expectation for this time of year.
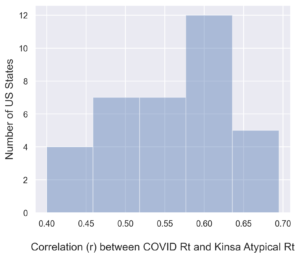
Figure 5: Correlation (Pearson’s r) between daily changes (first differences) in Kinsa atypical Rt and COVID-19 Rt. Atypical Rt is, on average, a 21-day leading indicator of COVID Rt trends.
These strong correlations between mobility and disease transmission might beg the question: Could mobility data be used as a proxy of upcoming outbreak characteristics? While limiting social interaction was used to control the first pandemic, successful re-opening requires the use of other non-mobility-based interventions to control transmission rates. These efforts, such as proactive testings/isolation and contact tracing, as implemented in Taiwan and South Korea, are intended to replace the shelter-in-place orders currently used in the United States. The impact of these interventions can not be easily monitored via mobility data, and instead will require a direct measure of disease transmission to monitor success. Given Kinsa atypical Rt’s strong ability to capture distancing-based changes in disease transmission, we are well placed to assess the quality of both distancing- and non-distancing-based interventions. These tools provide a powerful means to safely re-open communities by monitoring changes in community transmission, while also identifying regions of concern with abnormally high Rt values.
To learn more about the data behind this article and what Kinsa has to offer, visit https://www.kinsahealth.co/.


Sign up to receive our stories in your inbox.
Data is changing the speed of business. Investors, Corporations, and Governments are buying new, differentiated data to gain visibility make better decisions. Don't fall behind. Let us help.
Sign up to receive our stories in your inbox.
Data is changing the speed of business. Investors, Corporations, and Governments are buying new, differentiated data to gain visibility make better decisions. Don't fall behind. Let us help.