
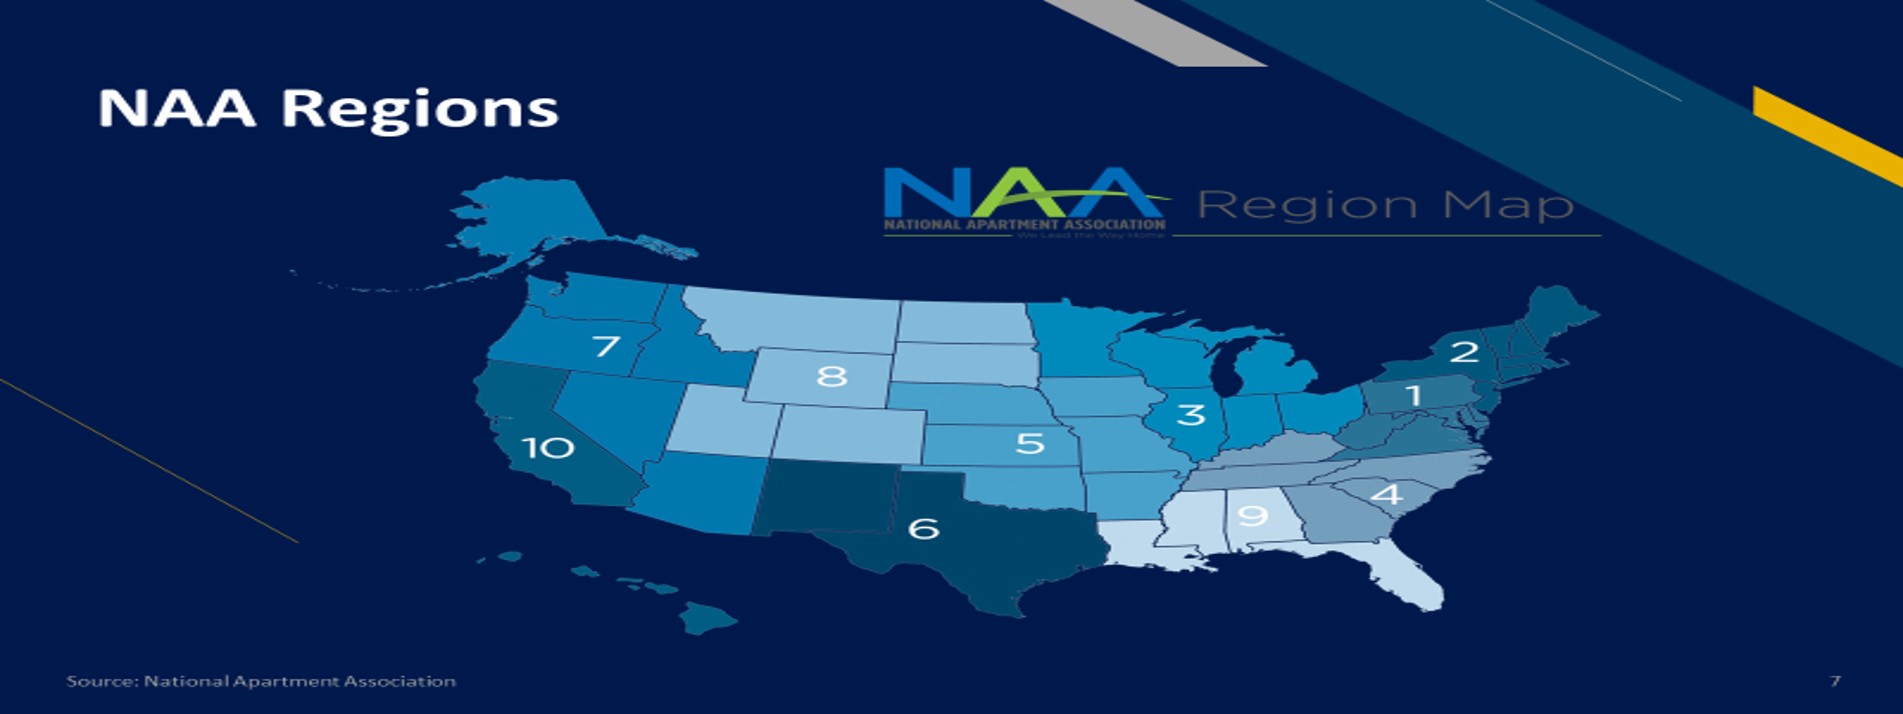
Amazingly, we’re now passed the halfway mark of 2020. The first six months of the year have been turbulent to say the least, and the first of a few different perspectives from which we’ll evaluate how multifamily has performed so far this year is from a regional perspective. Unless otherwise stated, all numbers will refer to conventional properties of at least 50 units. For the sake of familiarity, each region will be defined by the National Apartment Association region designations.
Average Occupancy
In Region 9, which includes Florida and the Gulf states, average occupancy losses were more severe than in other regions in the first half of the year. This has a lot to do with the make-up of the markets in this region – namely that there is a high concentration of oil and energy-concentrated markets as well as tourism and travel destinations.
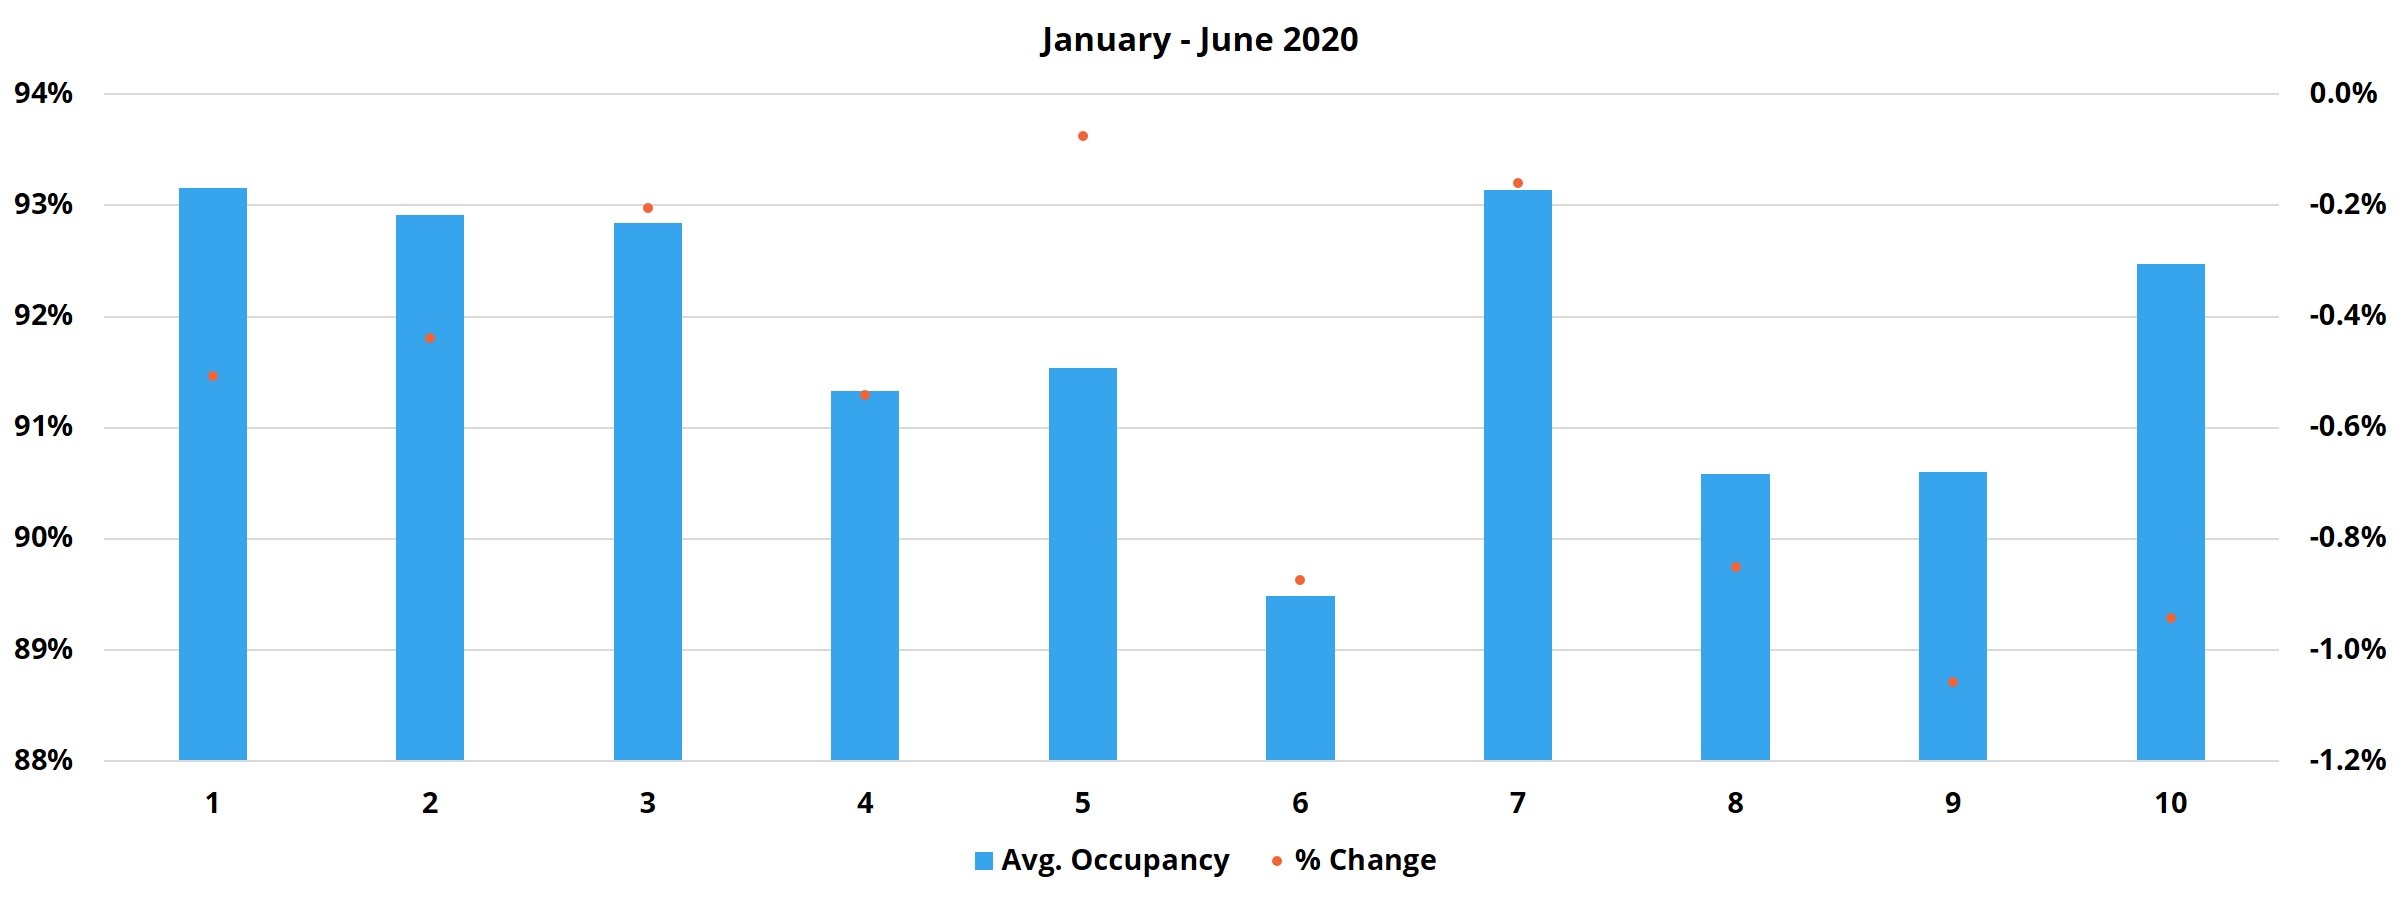
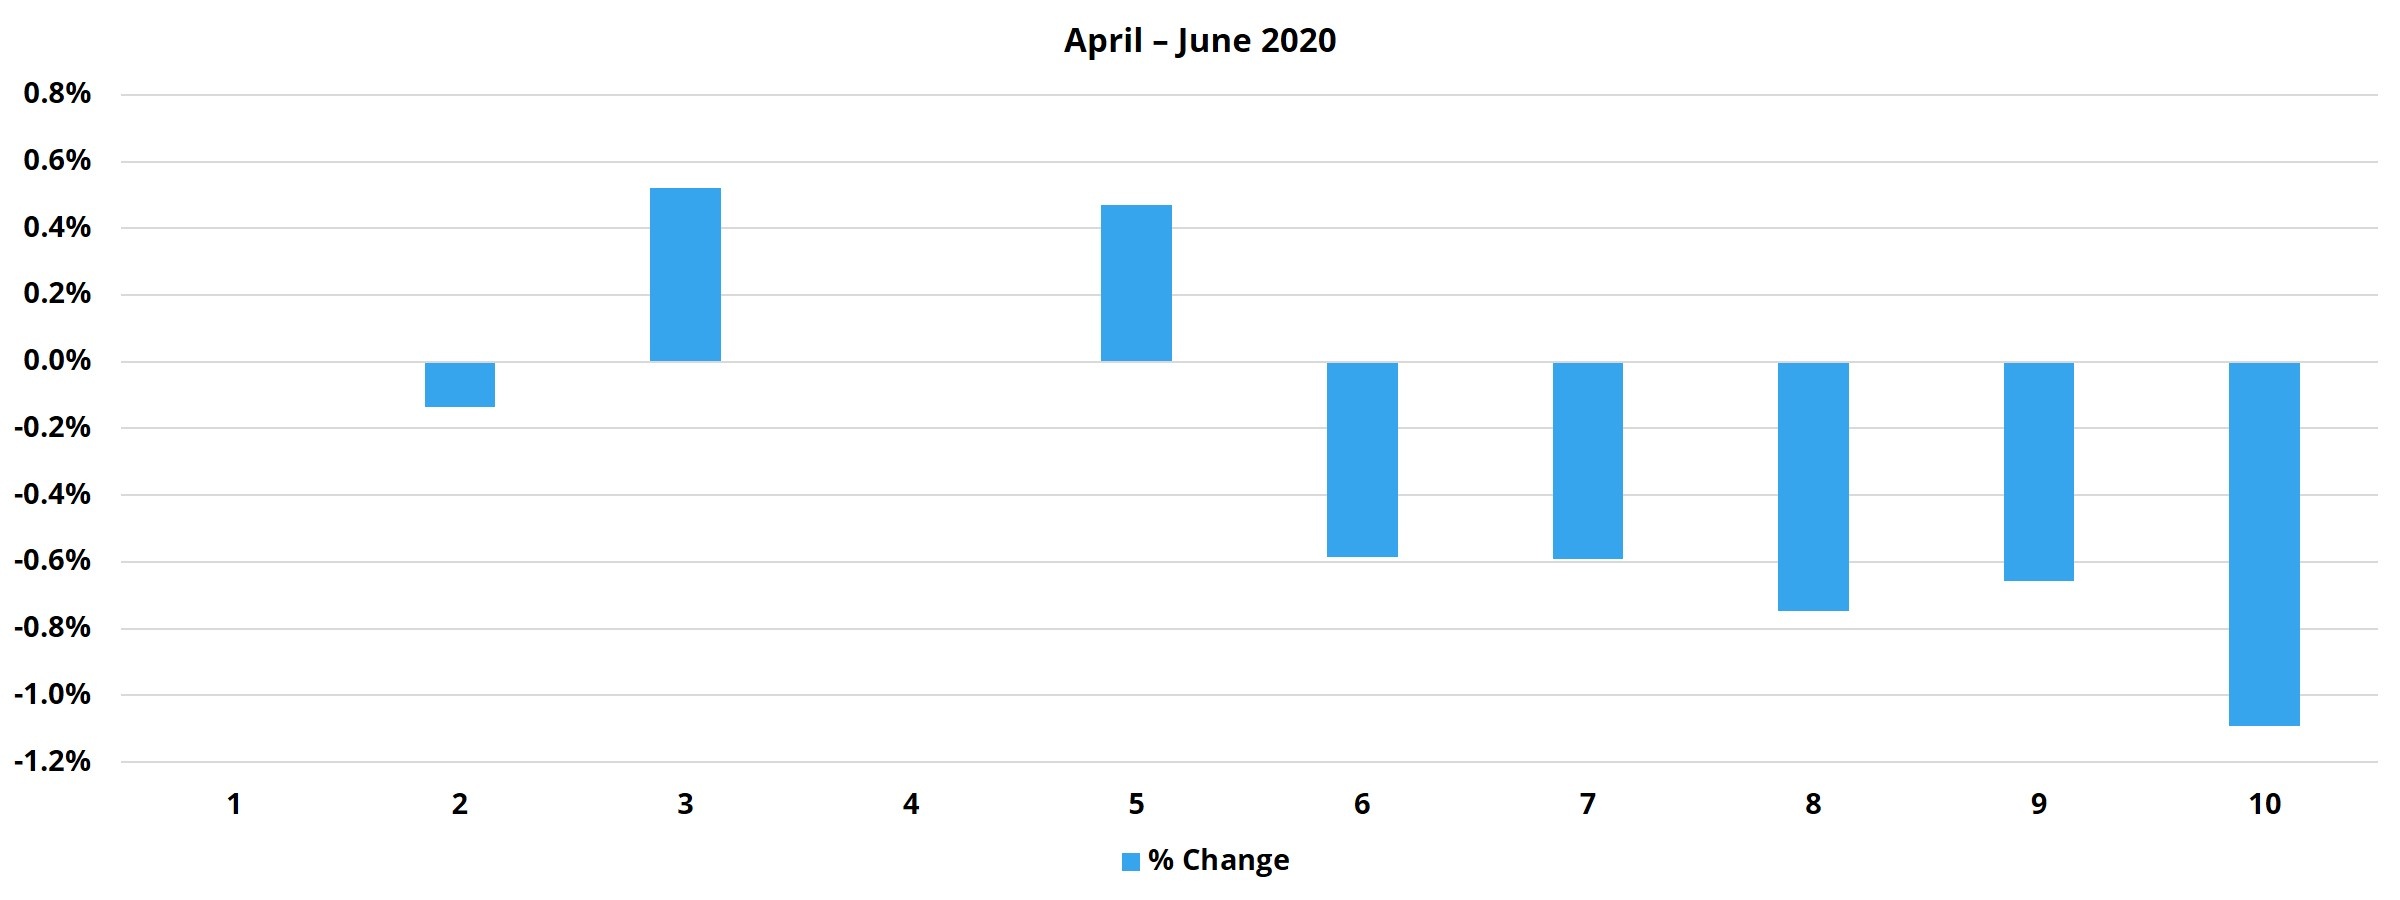
On the positive side, the Midwest states of Region 5 took advantage of a break in new supply to add to average occupancy in the second quarter. In Region 3, strong results in the Wisconsin markets of Green Bay, Madison and Milwaukee buoyed the average overall. In just the second quarter, Region 10 suffered the largest slide and was the only region to lose at least 1% in the quarter. Region 10 corresponds to California and Hawaii, so not only are there many popular travel destinations in these states, but also large, dense and expensive markets.
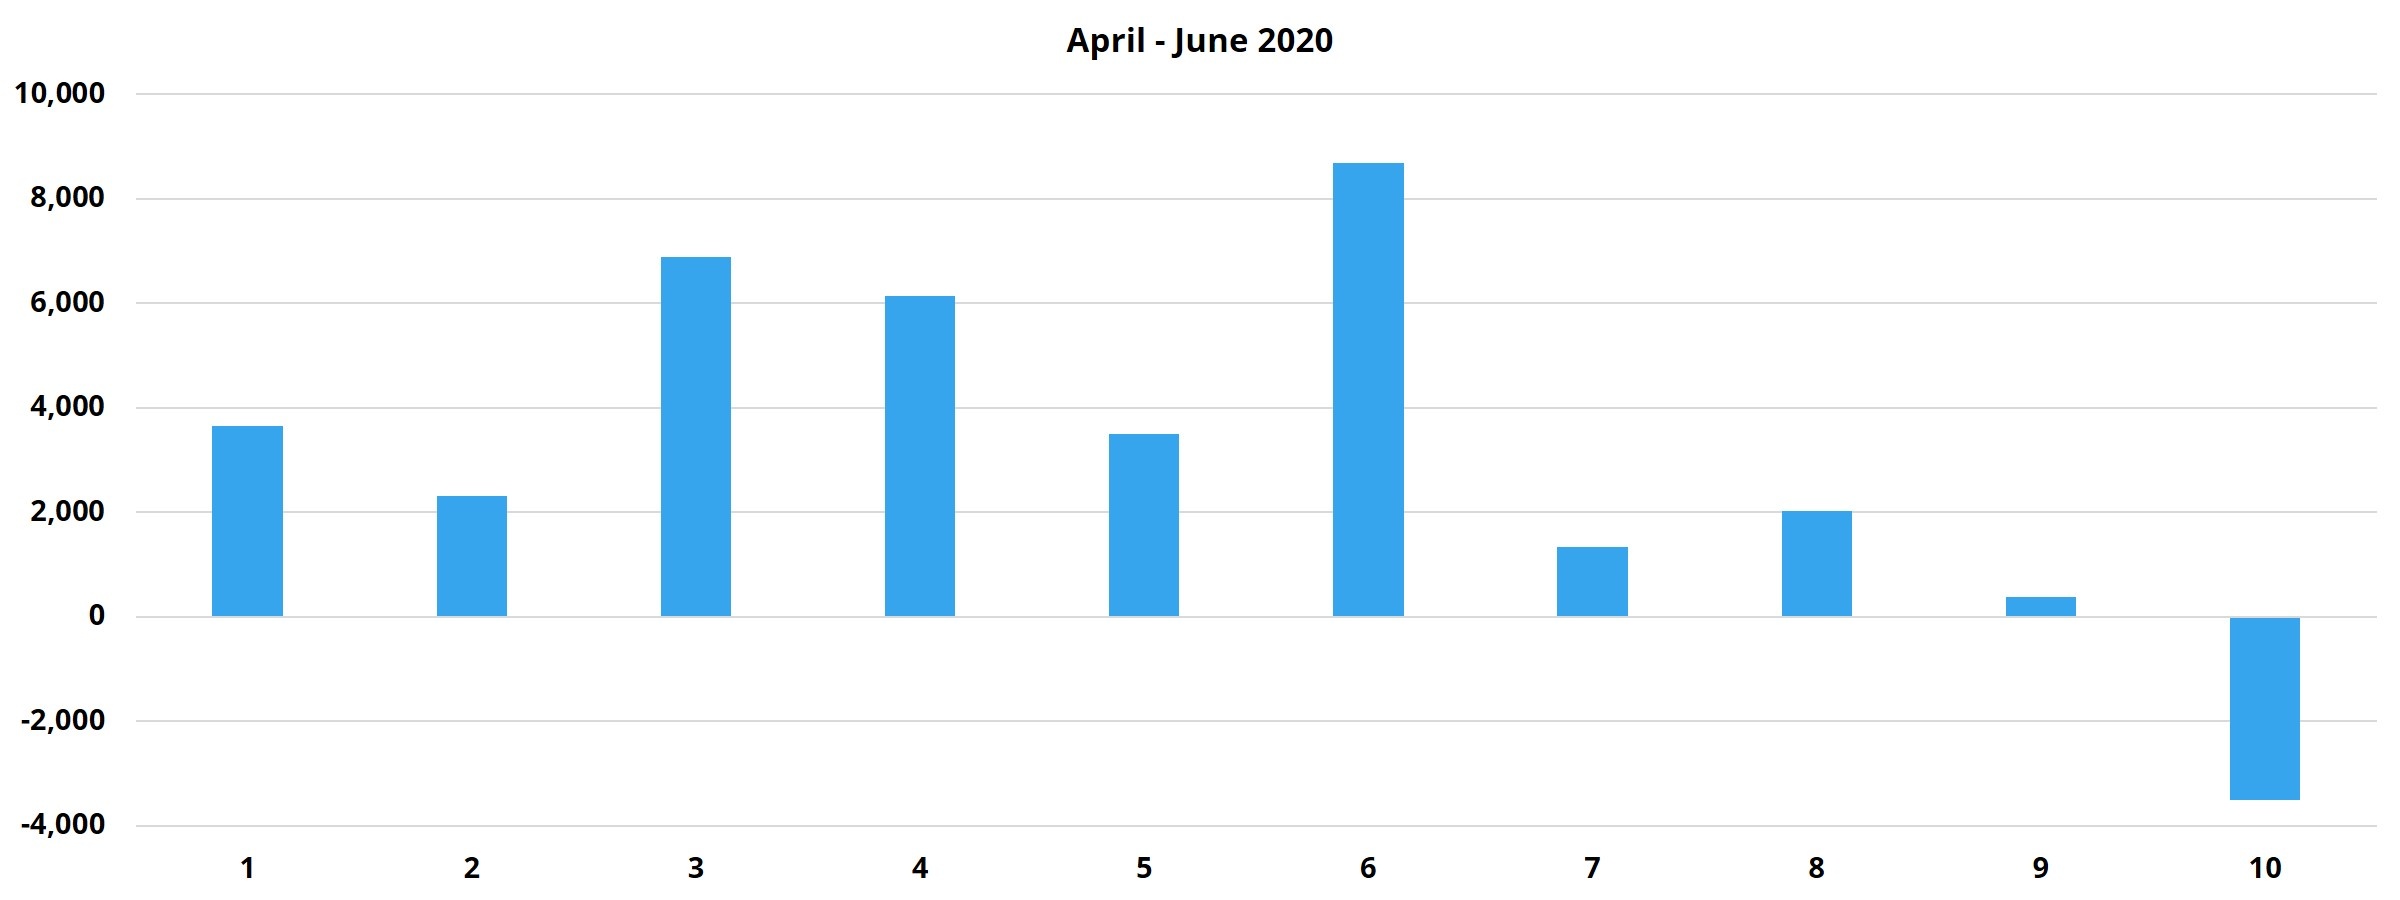
Net Absorption
Net absorption did not turn negative in any region in the first half of the year. Region 3 shows up in a positive way once again – relative to the rest of the country anyway. The specific areas driving that result were Chicago, Milwaukee and Columbus, OH.
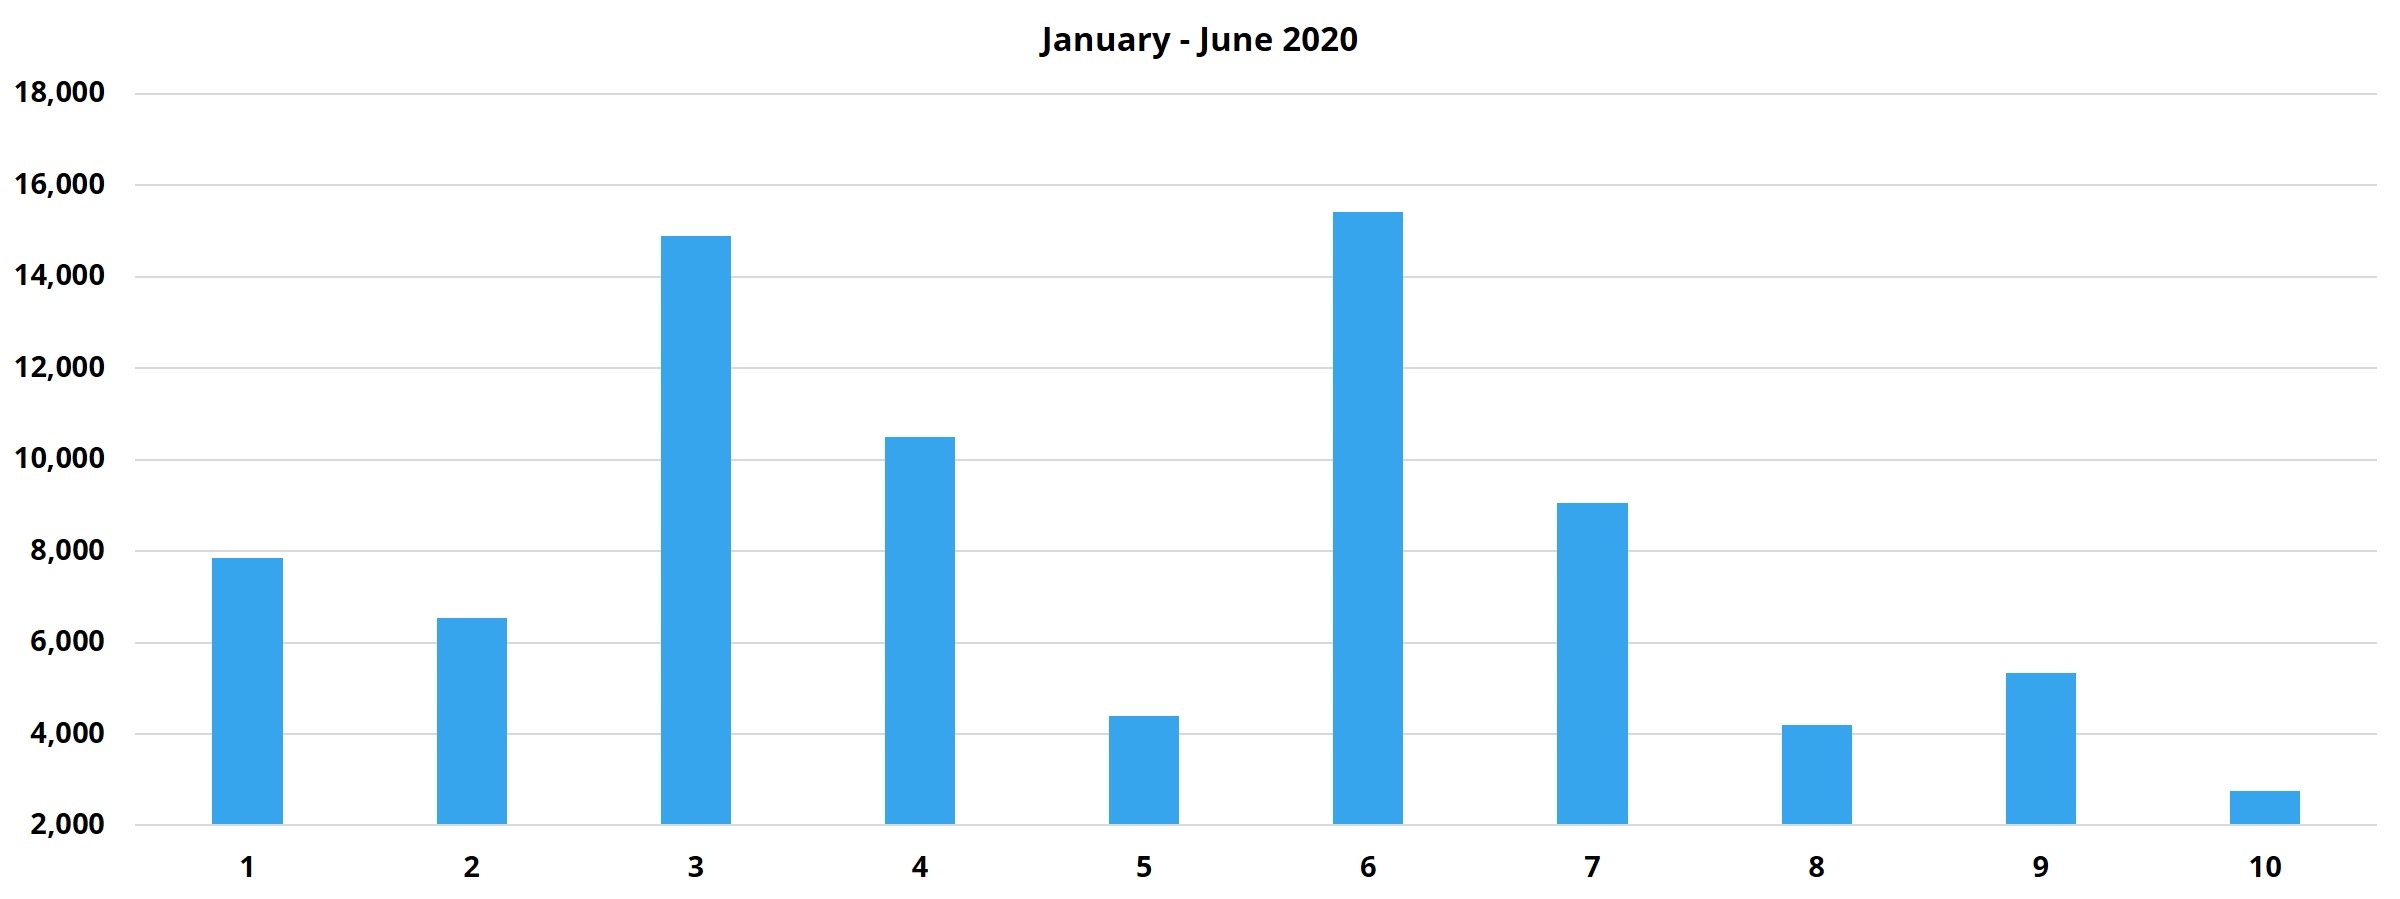
In Region 6, Dallas – Fort Worth added more net rented units than the remaining markets in the region combined. Nearly 9,200 previously unoccupied units were leased in DFW. That result masks a tough first six months for the region, as only San Antonio and Austin absorbed more than 1,000 net units. In each of those two markets new supply easily outpaced that demand. Looking only at the second quarter, California and Hawaii entered negative territory. This made Region 10 the only region to cross into negative territory.
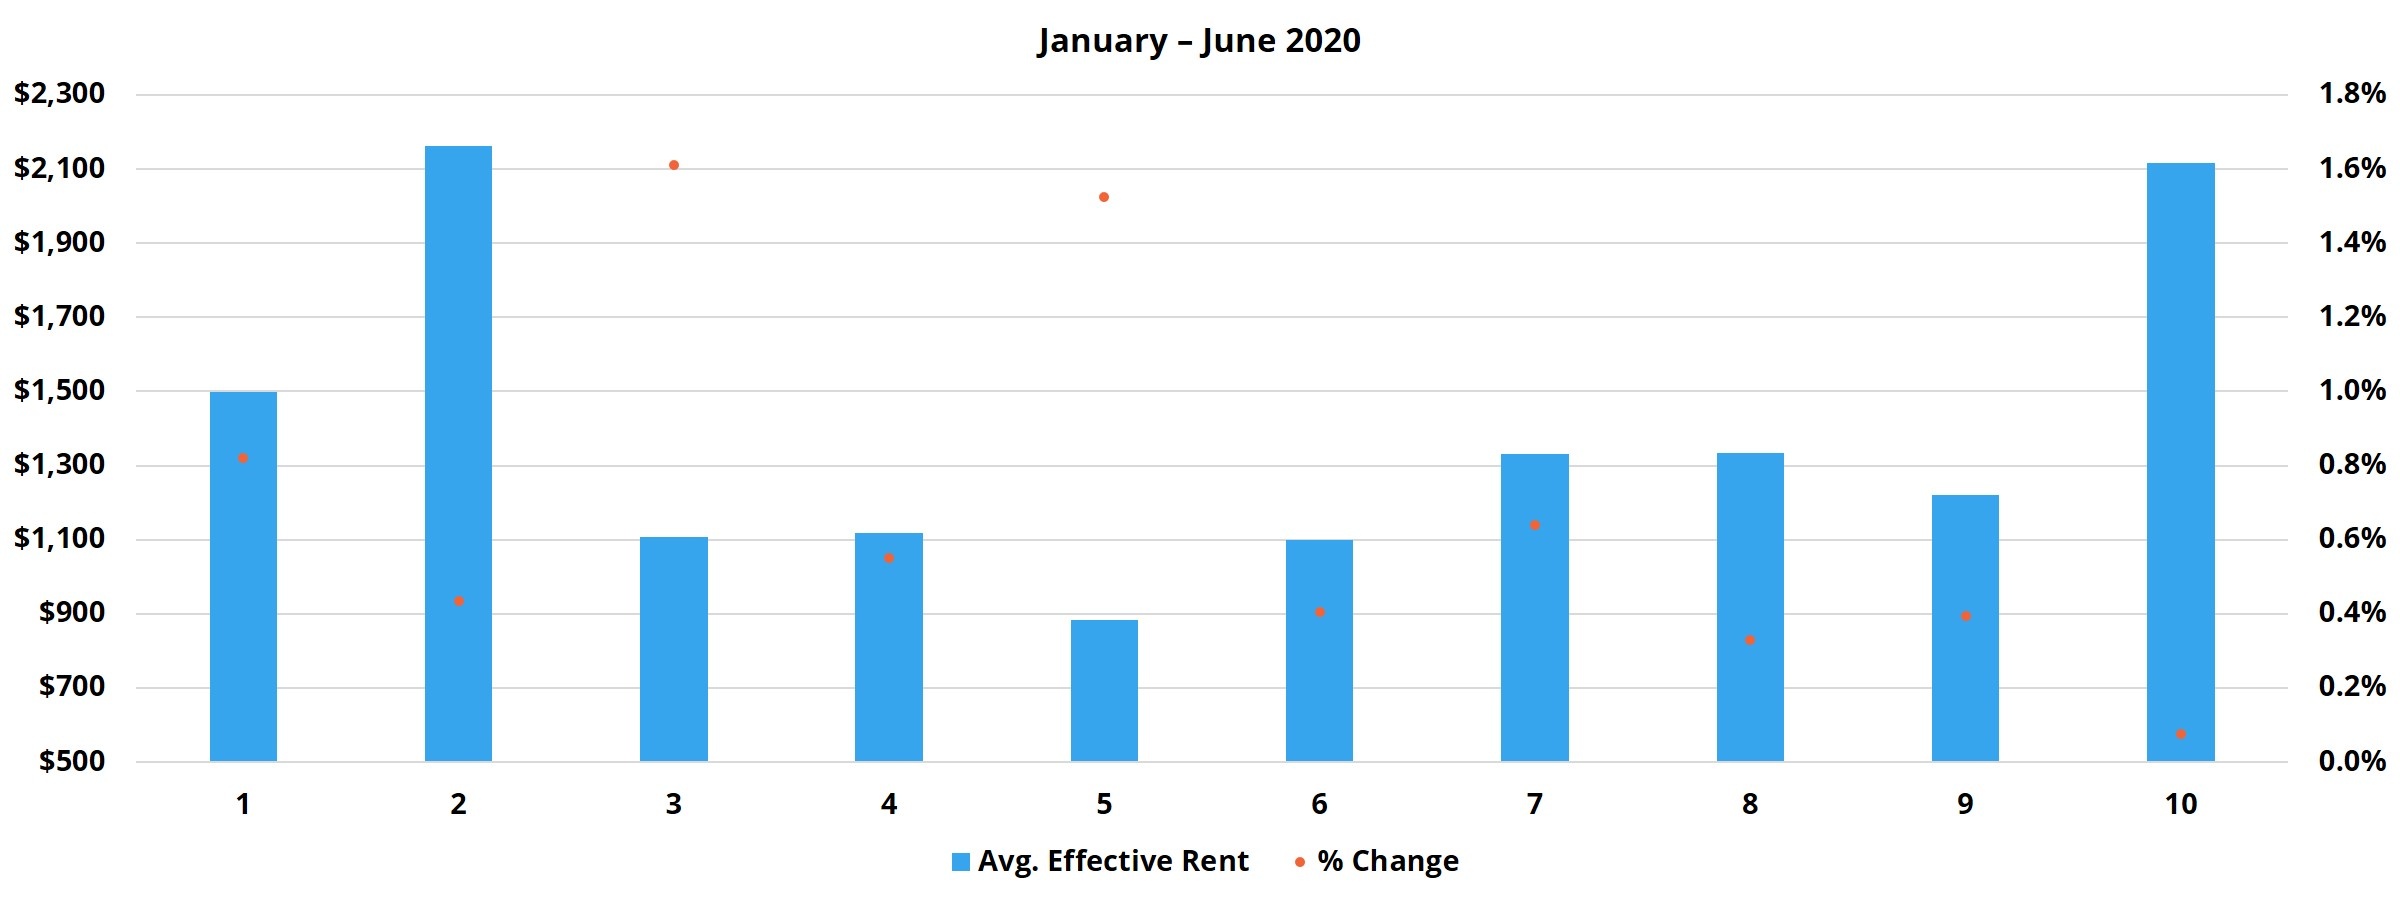
Average Effective Rent
Unsurprisingly, it was in the most expensive areas that average effective rent was hardest hit in the first half of the year. Though, no region experienced a decline at the average. Yet again, Region 3 and Region 5 stood out in a positive way.
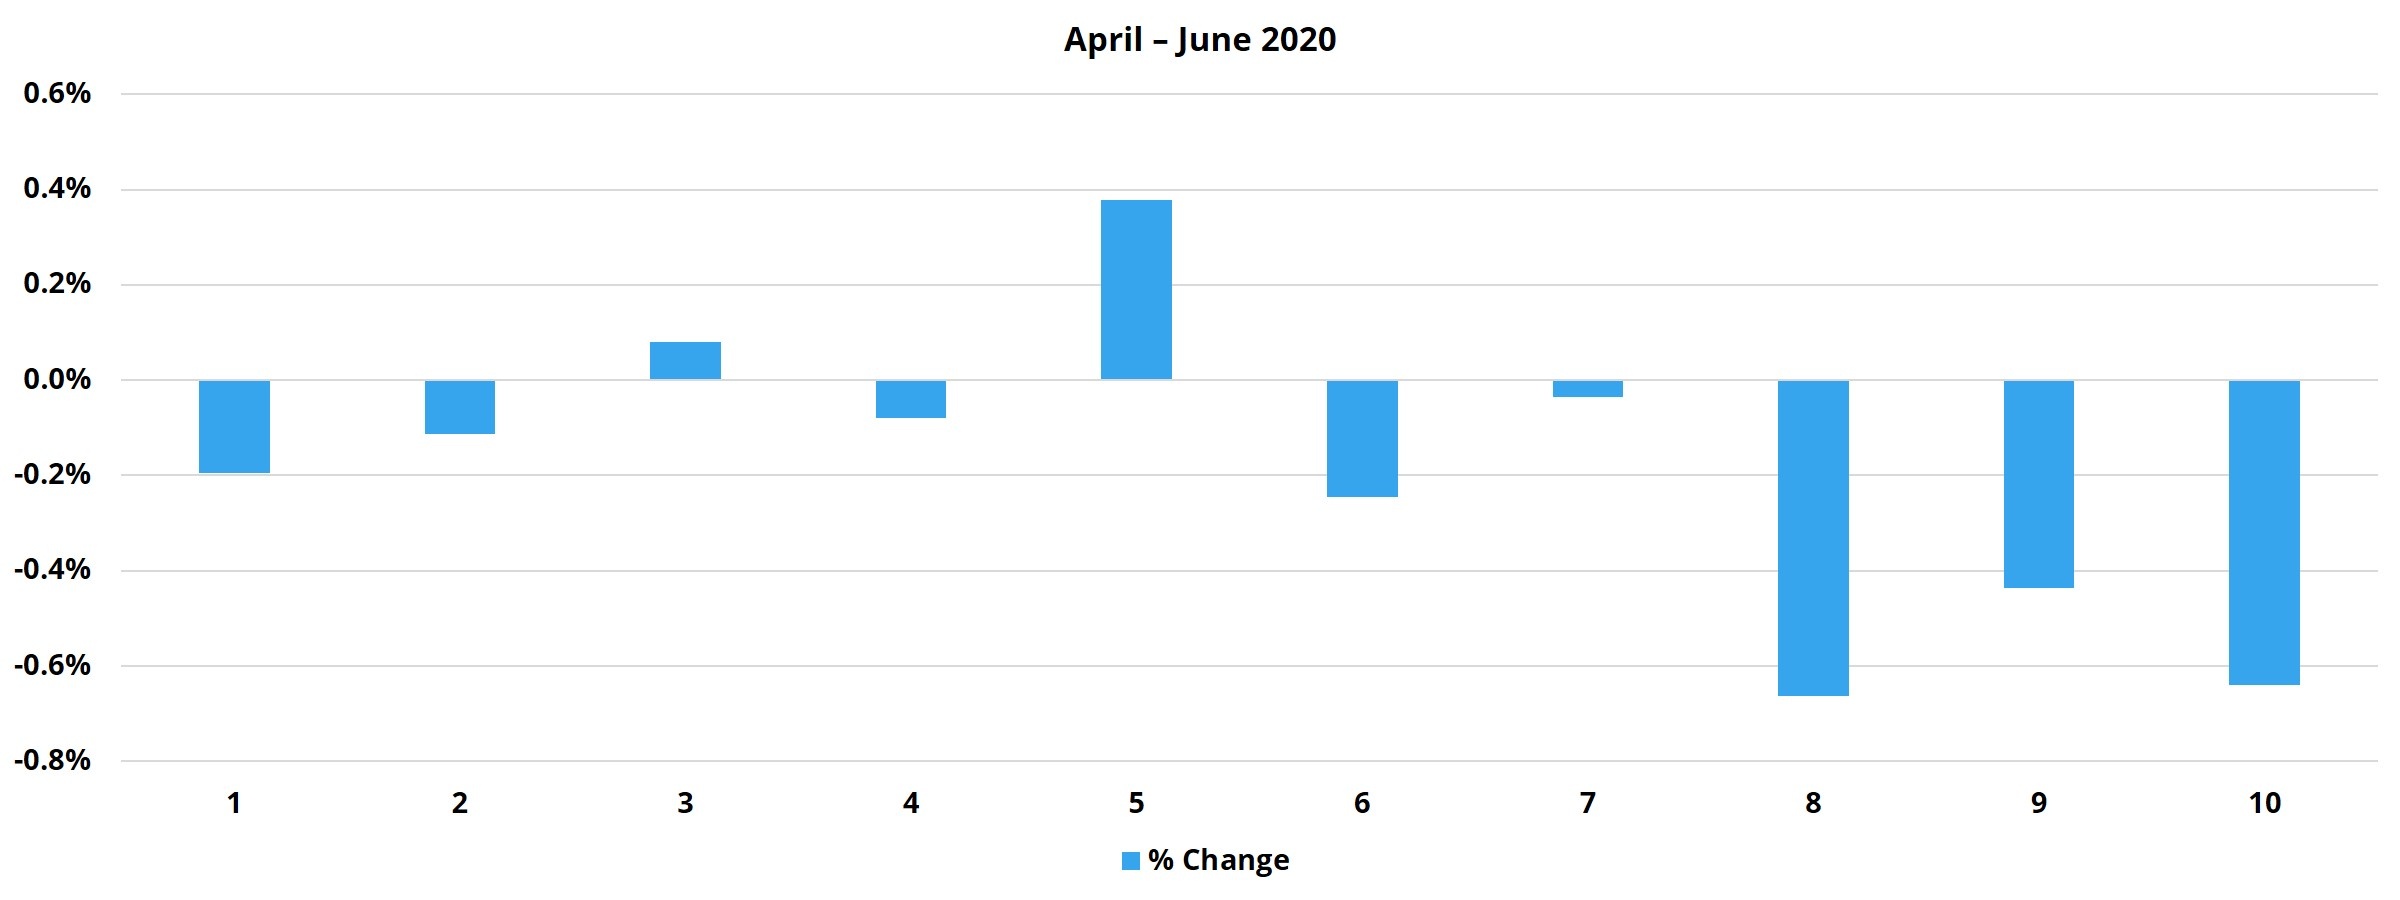
In just the second quarter, the Midwest and Great Lakes areas were the only two regions to avoid negative territory. For the most part, the quarterly declines were less than 0.25%, but once again, regions 8, 9, and 10 with their concentration of energy and travel markets were hardest hit.


Sign up to receive our stories in your inbox.
Data is changing the speed of business. Investors, Corporations, and Governments are buying new, differentiated data to gain visibility make better decisions. Don't fall behind. Let us help.


Sign up to receive our stories in your inbox.
Data is changing the speed of business. Investors, Corporations, and Governments are buying new, differentiated data to gain visibility make better decisions. Don't fall behind. Let us help.