Though the COVID-19 pandemic is occupying all attention at the moment, hurricane season has begun and natural catastrophes do not take a holiday. Forecasts for 2020 project higher than average hurricane activity, implying higher levels of devastating storm surge.
Heading into hurricane season, the prospect of confronting a large natural catastrophe like a hurricane or flood during the coronavirus crisis may seem daunting. But using modern data and analytics technology that combines hurricane models with property characteristics and building codes can boost resilience, even during these uncertain times.
Though the Atlantic hurricane season officially began on June 1, the first named storm of the season came earlier. Tropical storm Arthur, which formed on May 16, had the fifth earliest start date of all hurricanes since 1970. This is sooner than average, as the first named storm usually occurs around end of June. As the eastern and southern U.S. brace for another hurricane season, experts have began to forecast an outlook for this year’s potential severity.
Forecasting This Season’s Severity
Every year, a variety of institutions make their own predictions of the season’s hurricane frequency and severity. There are several factors these forecasts consider – the most significant of which are sea surface temperatures and the state of the El Niño Southern Oscillation.
Sea Surface Temperature
Hurricanes are fueled by the evaporation of warm seawater into the lower atmosphere. With higher water temperatures, there will be more evaporation and, thus, more energy present in the atmosphere. This higher energy contributes to longer and more severe hurricane systems.
Data indicates that sea surface temperatures are higher than normal. This is particularly true in the tropics, the main development region of Atlantic hurricanes.
El Niño Southern Oscillation
The El Niño Southern Oscillation (ENSO) describes year-to-year variations in sea-surface temperatures, rainfall, air pressure and atmospheric circulation that occur across the equatorial Pacific Ocean. There are two phases in ENSO – the warm phase, El Niño, and the cool phase, La Niña.
La Niña is typically associated with an increase in hurricane activity due to lower wind shear in the tropics. Most models predict that this year will be moving into neutral conditions, while some of them go further and predict weak La Niña conditions.
Figure 1: Enso Significant Factor In Activity
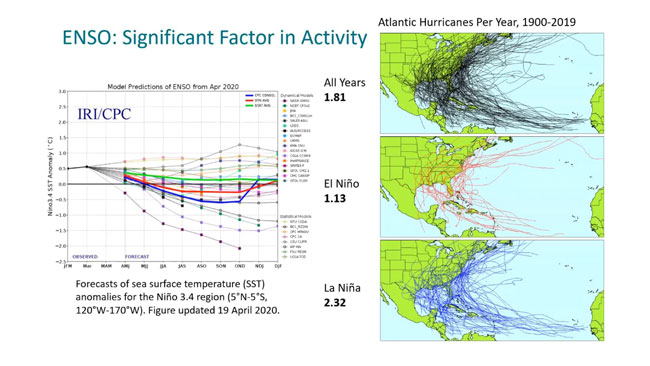
From 1900-2019, the average number of hurricanes in a year is 1.8. For El Niño, the average number per year is 1.1, with La Niña averaging 2.3 per year. And if neutral or La Niña conditions occur this year, there will expectedly be an increase in activity from last year.
Figure 2: Seasonal Forecasts Of Atlantic Hurricane Activity
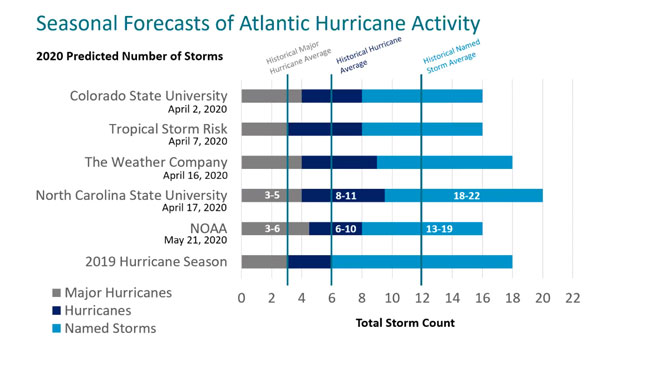
Forecasts for the 2020 season predict around four major hurricanes, eight total hurricanes and 16 named hurricanes. This prediction is significantly higher than the historical averages of roughly three major hurricanes, six total hurricanes and 12 named storms every year. Higher surface sea temperatures and neutral or La Niña conditions could mean above average activity this hurricane season.
More Hurricanes Mean More Storm Surge
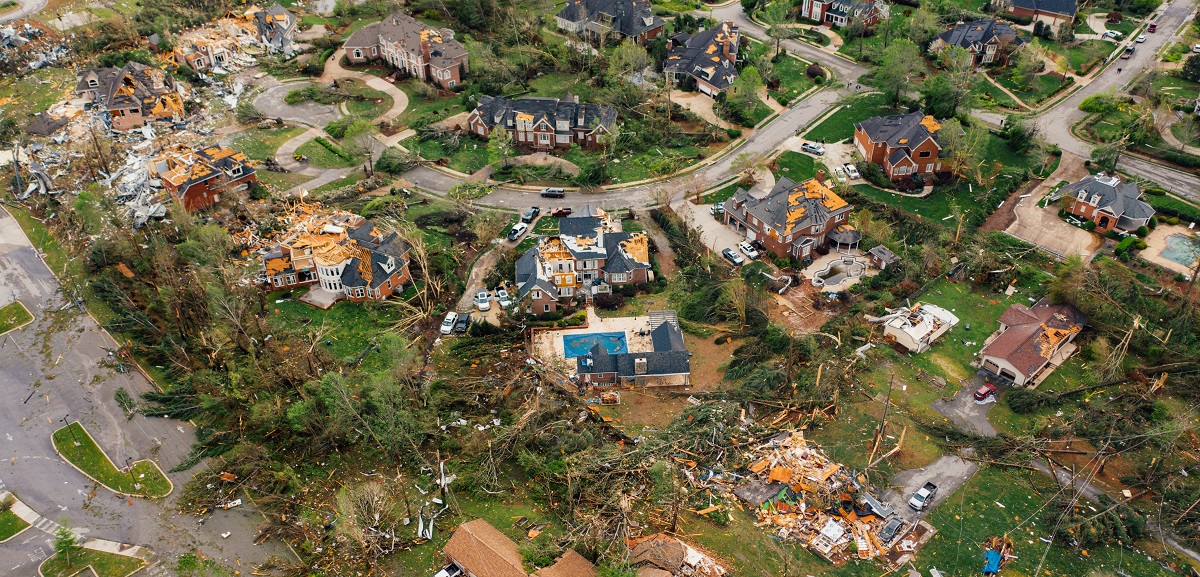
Storm surge is the rising of the sea as a result of the wind and pressure associated with a hurricane. Once a hurricane makes landfall, the mass of water in front of the moving storm hits the coastline and moves inland. This surge of water and wind poses a tremendous risk to life and property. The Hurricane Katrina storm surge in 2005 extended about six miles inland at maximum heights approaching 27 feet, and the phenomenon has prompted discussion on the threats posed by severe storm systems.
One of the biggest issues with storm surge is that it is often combined with simultaneous onshore precipitation. This means that while there is a mass of water from the hurricane moving inland, there is also a mass of water piling up from precipitation-based flooding that normally would be dissipated down streams and rivers towards the ocean. Consequently, storm surge exacerbates an already drastic flooding situation.
In order to quantify the risk storm surge poses, one must account the structure of the land mass itself. This includes factors like a property’s elevation, distance from the coast and barriers like roadbeds or levees. Possible impact damage caused by debris from buildings, tree limbs or vehicles should also be accounted.
Figure 3: Single Family Residences At Risk
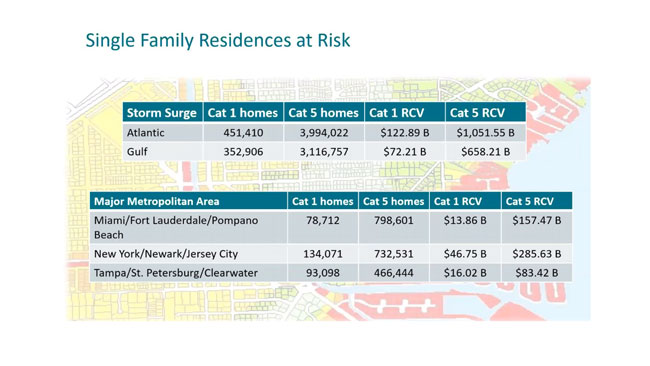
By combining these factors, CoreLogic can create an inventory of all the homes that will experience damage from surge and calculate the reconstruction value in a region.
One of the limitations of modeling risk from storm surge is that without knowing the specific details of the individual storm, one must assume 100% loss for each property. With this assumption, it can be estimated that the top three metropolitan areas with the most potential damage to a number of homes are the Miami, New York, and Tampa metros. For more information on how to quantify storm surge risk, download our 2020 Storm Surge Report.
Local Building Codes Determine Risk
Building codes are the primary determinant of a building’s resilience to natural hazards. These codes influence all aspects of a structure, including the design of the roof, windows and doors. Within a state, building regulations will often vary by region.
Florida, a state known for its routine susceptibility to hurricane damage, has unique design standards for specific areas. Some regional regulations are considerate of high velocity debris zones, thus, assisting in reducing damage from flying debris. But while building codes are constantly improving over time, many communities are not rebuilding. This means many older communities are still at significantly higher risk of damage.
The damage of a home is often directly related to the wind speed at the site. Lower windspeeds often cause roof damage correlated with roof materials, roof age, eaves and parapets. Higher windspeeds often cause more extensive structural damage correlated with window glazing and roof diaphragm connections.
CoreLogic Using Local Building Codes To Estimate Claims
By leveraging CoreLogic data to determine locations of all properties in a region, we can create a probabilistic model that runs a suite of all intensities of hurricanes along a coastline to estimate the number of potential claims. In this simulation, we plotted two sets of data: the estimated number of claims for a Category 1 hurricane and the estimated number of claims for a Category 4 hurricane.
Figure 4: Estimated Claim Counts By Landfall Location And Intensity
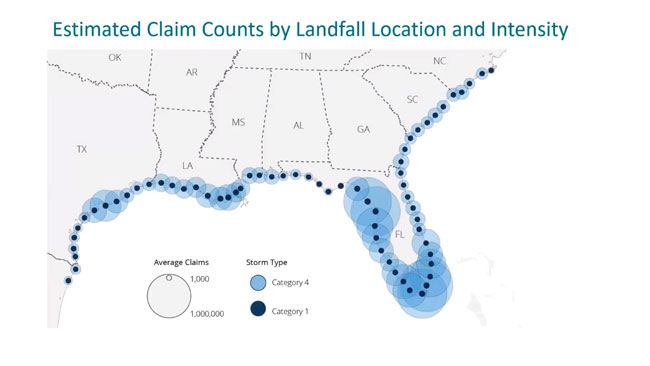
The model runs hypothetical hurricanes with varying landfall destination to estimate which landfall locations would result in the most damages. The risk of hurricane damage is very dependent upon the hurricane’s landfall destination and intensity. Across the board, Category 1 hurricanes demonstrate a consistent number of average claims regardless of landfall location. However, for Category 4 hurricanes, the landfall location plays an outsize role in the number of claims. In the South Florida Tri-County area, the number of claims for a Category 4 hurricane could reach as high as 1 million.
In Conclusion
Hurricane season is here, and experts are projecting above average activity. By accounting for the effects of storm surge and incorporating property characteristics and building codes into prediction models, communities and insurers can become more resilient in the face of hurricanes. Hurricane-exposed insurers can use these technologies to be more prepared for this year’s season.
To learn more about the data behind this article and what CoreLogic has to offer, visit https://www.corelogic.com/.


Sign up to receive our stories in your inbox.
Data is changing the speed of business. Investors, Corporations, and Governments are buying new, differentiated data to gain visibility make better decisions. Don't fall behind. Let us help.


Sign up to receive our stories in your inbox.
Data is changing the speed of business. Investors, Corporations, and Governments are buying new, differentiated data to gain visibility make better decisions. Don't fall behind. Let us help.