
National home prices increased 5.9% year over year in August 2020, according to the latest CoreLogic Home Price Index (HPI®) Report. The August 2020 HPI gain was up from the August 2019 gain of 3.5% and was the highest year-over-year gain since June 2018. Meanwhile, for-sale inventory has continued to dwindle, dropping 17% year over year in August, which created upward pressure on home price appreciation as buyers compete for the limited supply of homes.
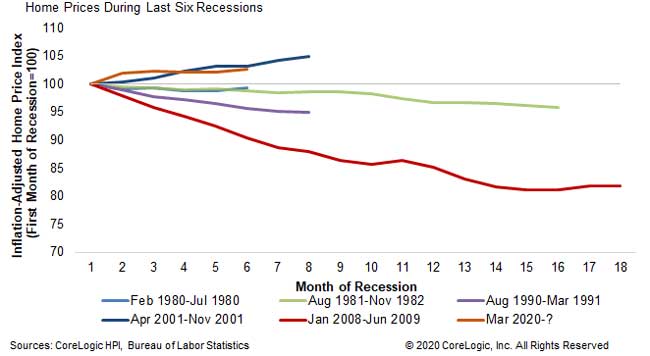
The economic downturn that started in March 2020 is predicted to slow the HPI increase to 0.2% by August 2021, which would be the lowest increase in annual home prices since January 2012. Figure 1 shows movements in the inflation-adjusted HPI[1] for the six most recent recessions starting from the first month and through the end of each recession. Numbers below 100 indicate falling home prices, which has been a feature of four of the six recessions. However, at six months in, the 2020 recession is following the path of the 2001 recession, which is the only other one of the six with increasing home prices. The worst of the six recessions was the Great Recession that started in 2008, which was characterized by excess supply of homes for sale, which is not the case in today’s tight-supply housing market.
Figure 1: Home Prices Typically Fall During Recessions, But Prices Up in 2020
CoreLogic analyzes four individual home-price tiers that are calculated relative to the median national home sale price[2]. Home price growth has accelerated for all four price tiers this year to the highest rates since 2018 for the two lower price tiers and 2014 for the two higher price tiers. The lowest price tier increased 8.6% year over year in August 2020, compared with 7.3% for the low- to middle-price tier, 6.7% for the middle- to moderate-price tier, and 5.6% for the high-price tier.
Figure 2: After Slowing in May, Home Price Growth Picks up Speed Again in July
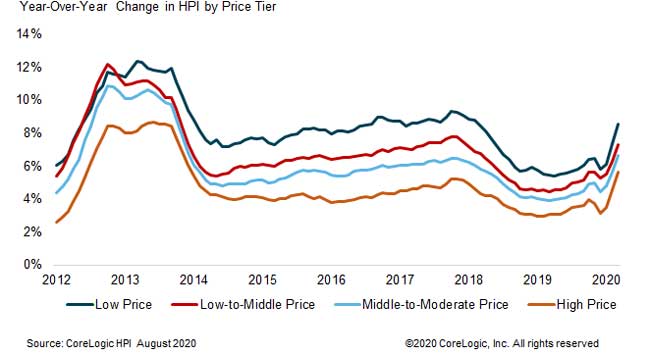
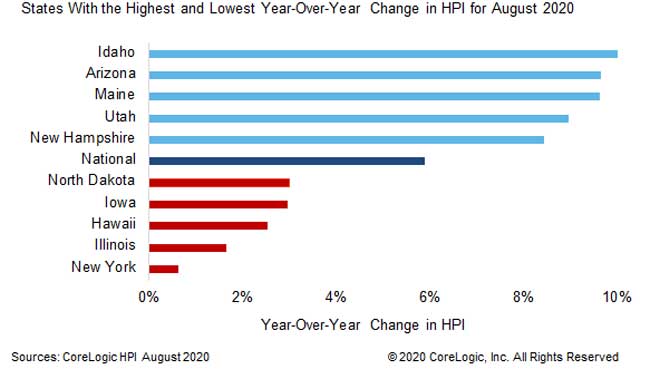
Figure 3 shows the year-over-year HPI growth in August 2020 for the 5 highest- and lowest-appreciating states. All states showed annual increases in HPI in August, and Idaho led the states in appreciation as it has since late 2018, with annual appreciation of 10.8%. At the low end, New York saw an increase in home prices of 0.6%.
Figure 3: All States Showed Annual Increases in HPI in July
[1] The Consumer Price Index (CPI) Less Shelter was used to create the inflation-adjusted HPI. It is important to adjust the HPI for inflation to compare recessions, especially since two of the recessions occurred during very high inflation periods.
[2] The four price tiers are based on the median sale price and are as follows: homes priced at 75% or less of the median (low price), homes priced between 75% and 100% of the median (low-to-middle price), homes priced between 100% and 125% of the median (middle-to-moderate price) and homes priced greater than 125% of the median (high price).
To learn more about the data behind this article and what CoreLogic has to offer, visit https://www.corelogic.com/.


Sign up to receive our stories in your inbox.
Data is changing the speed of business. Investors, Corporations, and Governments are buying new, differentiated data to gain visibility make better decisions. Don't fall behind. Let us help.


Sign up to receive our stories in your inbox.
Data is changing the speed of business. Investors, Corporations, and Governments are buying new, differentiated data to gain visibility make better decisions. Don't fall behind. Let us help.